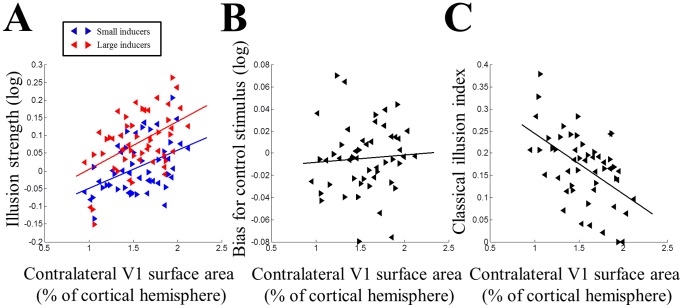
Figure 3. Illusion strength and V1 surface area.
A. Individual illusion strengths plotted against the surface area of contralateral V1 (expressed as percentage of the cortical hemisphere). Blue: small inducers. Red: large inducers. B. Bias in size perception for the control stimulus (without any inducers) plotted against contralateral V1 surface area. C. “Classical illusion index” calculated from the illusion strengths for small and large inducers plotted against contralateral V1 surface area. In all plots, left and right pointing triangles denote measurements from left and right visual hemifields in individual participants, respectively. Solid lines are linear regression fits.

