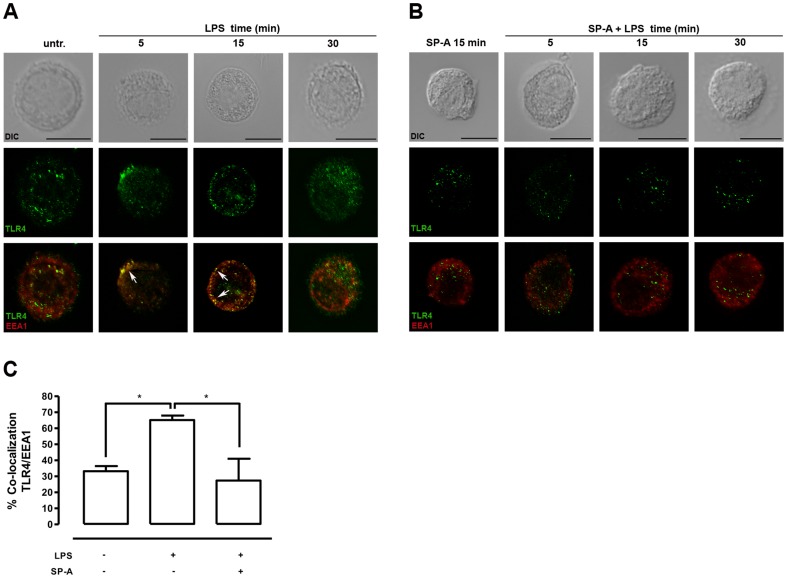
Figure 2. SP-A inhibits the LPS-induced co-localization of TLR4/EEA 1 in rat AM.
A and B, Representative IF for TLR4 localization in primary rat AM treated with LPS (100 ng/ml), SP-A (40 µg/ml), or both as indicated. Images are representative of at least three independent experiments in which over 80% of the cells had similar staining patterns. Early endosomes were stained with EEA1. Arrows indicate the area of co-localization. Upper panels, DIC image. Middle panels, TLR4 staining. Lower panels, overlay of single stainings. Scale bars, 10 µm. C, Analysis of TLR4 and EEA1 co-localization. Values are expressed as percentage ± SEM of at least two independent experiments with at least 20 cells per condition. Data were statistically analyzed by one-way ANOVA with Bonferroni's posttest. *p<0.05.

