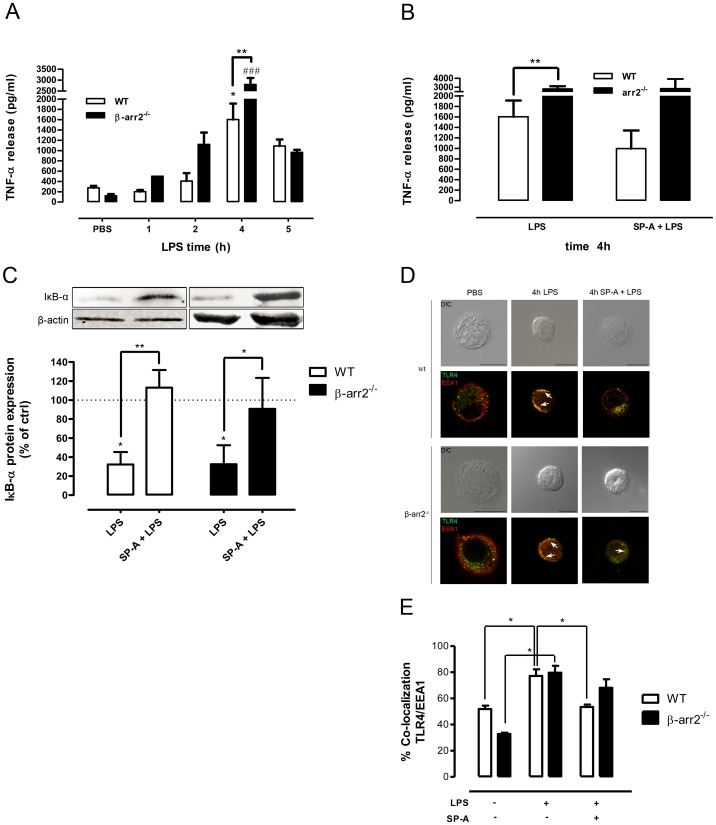
Figure 6. SP-A fails to inhibit enhanced LPS responsiveness in β-arrestin 2−/− mice.
A and B, TNF-α release in BAL fluid obtained from WT (n = 4–5) and β-arrestin 2−/− mice (n = 3–5) at different times after intratracheal administration of 2.5 µg/kg BW of LPS or 5 mg/kg of SP-A plus 2.5 µg/kg of LPS. The control group received LPS-free PBS. *p<0.05 (LPS- versus PBS-treated WT mice); ### p<0.001 (LPS-versus PBS-treated β-arrestin 2−/− mice); **p<0.01 (LPS-treated WT mice versus LPS-treated β-arrestin 2−/− mice). C, Western blot of cytosolic IκB-α protein expression in BAL cells from WT and β-arrestin 2−/− mice 4 h after intratracheal administration of LPS or SP-A plus 2.5 µg/kg of LPS. Equal amounts of cytosolic fractions were subjected to SDS-PAGE and immunoblotted for IκB-α and β-actin. Data of three independent experiments were normalized to β-actin, basal IκB-α expression was set 100%, and calculated data were statistically analyzed by one-way ANOVA with Bonferroni's posttest. *p<0.05; **p<0.01. D, Representative IF for TLR4 localization in BAL cells from WT and β-arrestin 2−/− mice after intratracheal administration of LPS or SP-A plus LPS. Images are representative of at least two independent experiments in which over 80% of the cells had similar staining patterns. Early endosomes were stained with EEA1. Arrows indicate the area of co-localization. Scale bars, 10 µm. E, Analysis of TLR4 and EEA1 co-localization. Values are expressed as percentage ± SEM of two independent experiments with at least 20 cells per condition. Data were statistically analyzed by one-way ANOVA with Bonferroni's posttest. *p<0.05.

