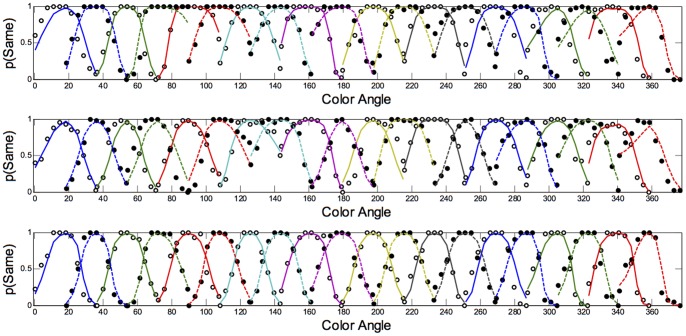
Figure 11. Categorization Short Duration (50 ms): Predictions of the model to each of the blocks for Observers AR (top panel), DC (middle panel) and DO (bottom panel).
Data are shown as dots; the model predictions are shown as lines fit to the data. Color and style of lines and dots are alternated for clarity.

