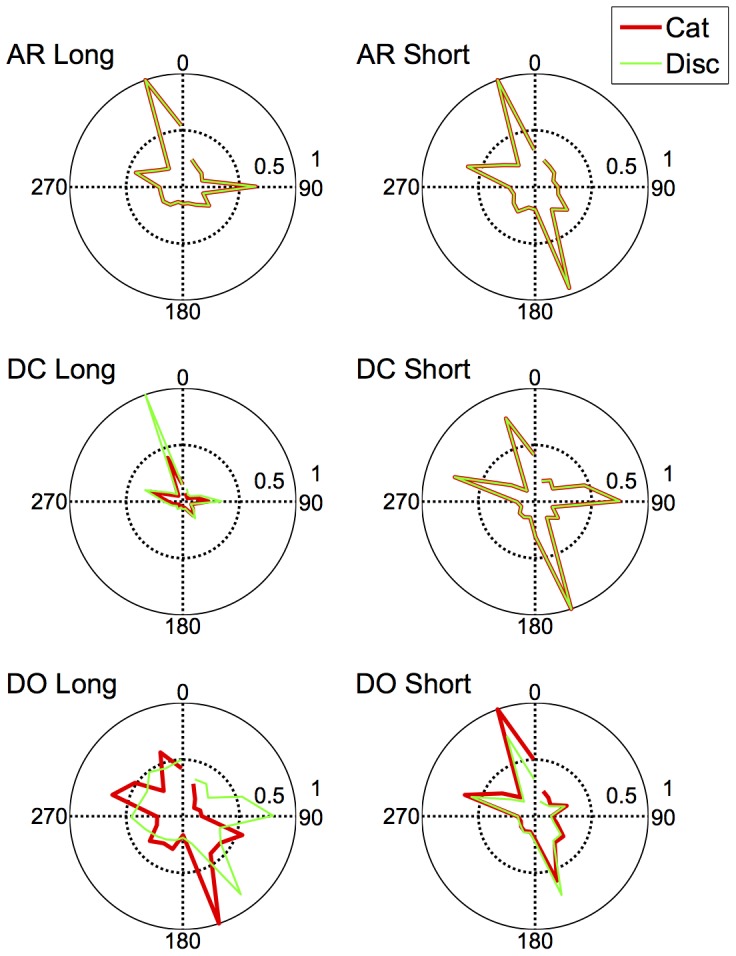
Figure 13. Specificity parameter, c, from the best fitting model (see text for details) plotted at each reference point for the categorization condition (red) and discrimination condition (green).

Left hand panels show the long duration condition; right panels show the short duration condition. The specificity parameters were standardized to have a maximum value of 1 by dividing by the maximum estimated specificity (i.e., cmax = [45.31, 57.38, 15.86] for observers AR, DC and DO in the long duration condition and cmax = [34.25, 407.2, 23.59] for observers AR, DC and DO in the short duration condition).
