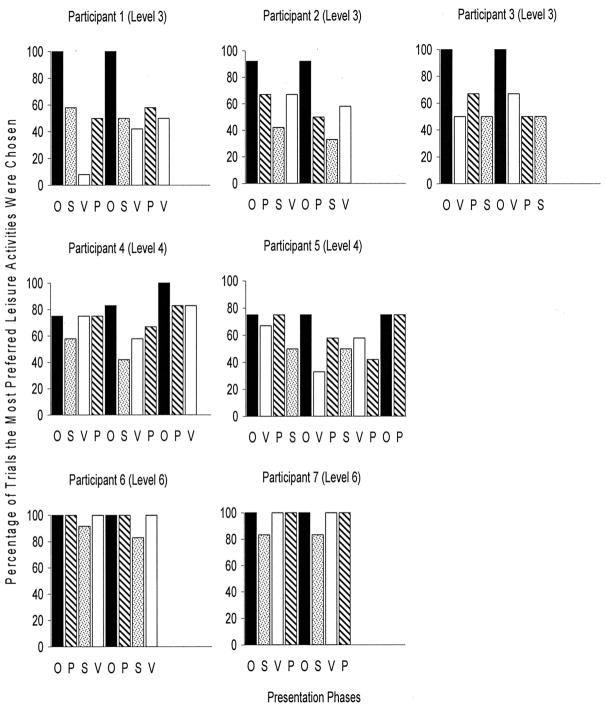
Figure 1.
Percentage of trials that the most preferred leisure activity was chosen during object (O), pictorial (P), video (V), and spoken (S) presentation phases for each participant. Participants at Level 3 passed only the visual discrimination, participants at Level 4 passed both visual and visual matching-to-sample discriminations, and participants at Level 6 passed visual, visual matching-to-sample, and auditory-visual discriminations.

