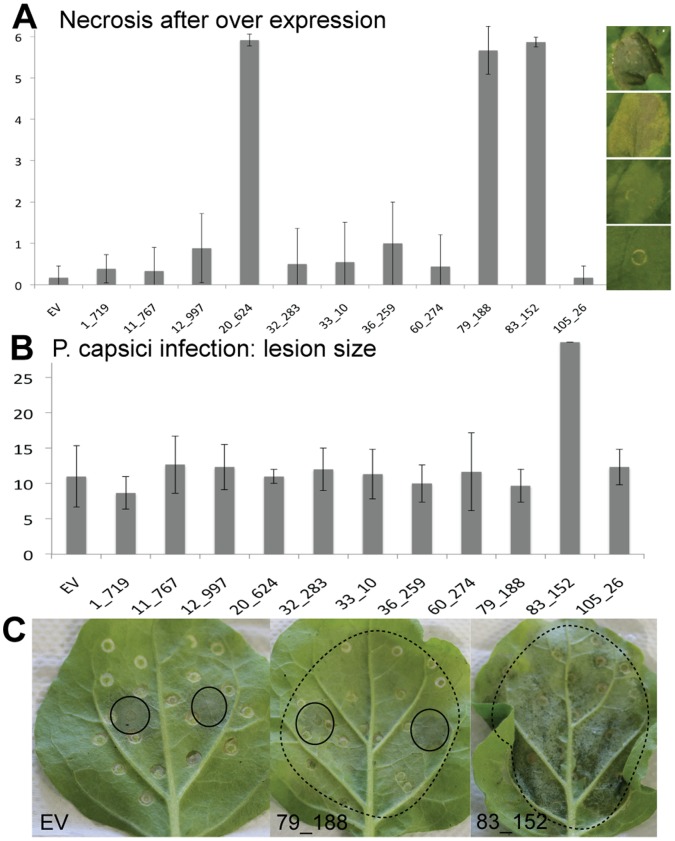
Figure 7. Phenotypic and functional analyses of CRN effector domains in planta.
A) Only three CRNs caused necrosis after over-expression in plants. Bars show average values for at least three independent infiltration events with four or more infiltration sites per construct per event. B) One CRN had a direct effect on virulence of P. capsici. Lesion size for all other CRNs was similar to that of the empty vector (EV) control. Error bars show standard deviations within the samples. Lesion size was measured during three independent infection events using four infection sites per construct. C) Onset of necrosis was not responsible for increased virulence. Panel 2 shows necrosis onset (dotted circles) for 79_188, but no increase in P. capsici lesion size (full circles) as seen for 83_152 (Panel 3). Panel A, X-axis: necrosis score as defined by picture panels on the right, Panel B X-Axis, Lesion size in mm.

