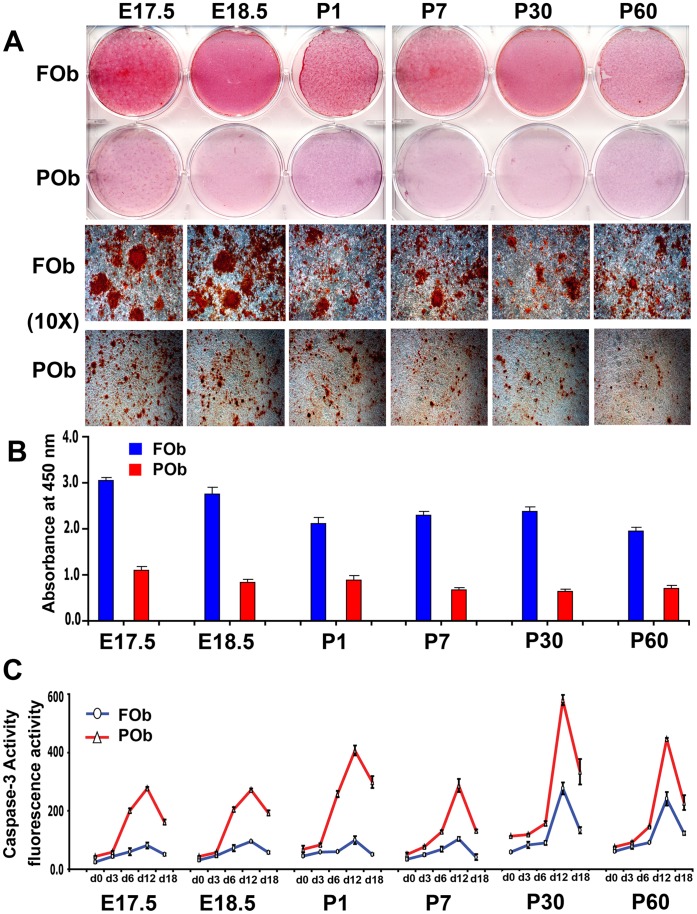
Figure 1. Apoptotic profile of FOb and POb cells undergoing to osteogenic differentiation.
(A) Alizarin red staining of FOb and POb cells at differentiation day 21 shows striking differences between FOb and POb, with FOb cells having a more robust mineralization and larger bone nodules as seen in the lower panel (Magnification 10X). (B) Quantification of Alizarin red staining. (C) Time course of Caspase-3 activity performed during osteogenic differentiation of FOb and POb cells harvested from different mouse stages reveals significant higher apoptotic activity in POb cells with a peak at d12 of differentiation. Abbreviations: (E), embryonic; (P), postnatal.

