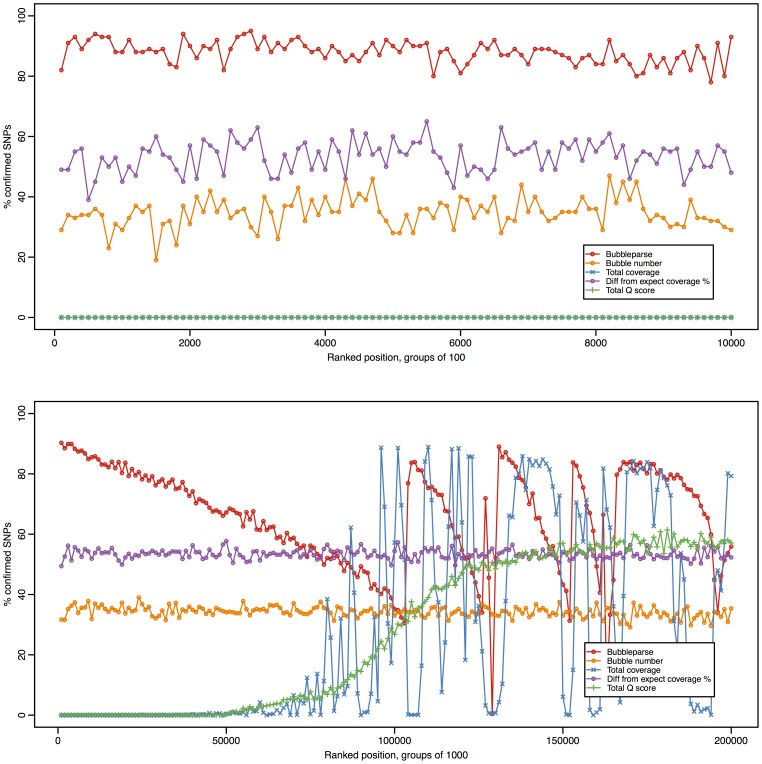
Figure 5. Efficacy of five different methods for ranking bubbles.
In the top graph, moving down the ranked tables, groups of 100 bubbles were taken and compared with the canonical set to calculate the percentage of ‘true’ bubbles. In the bottom graph, groups of 1000 bubbles were taken, allowing the majority of the bubbles to be included. Ranking by the Bubbleparse heuristic produces a much higher true positive rate than any of the alternative methods over the top 50,000 SNPs. From around the 100,000 mark, the Bubbleparse line exhibits a saw shape, the peaks of which are caused by the individual constituents of the ranking heuristic. Note, in the top graph, the blue trace (total coverage) is obscured by the green trace, as both are almost 0.

