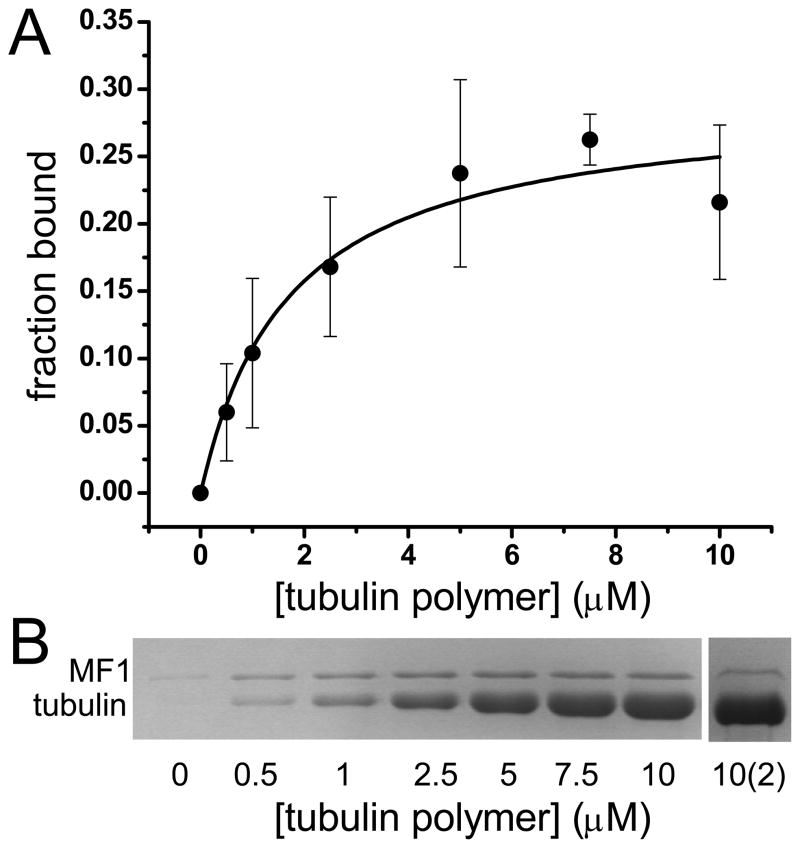
FIGURE 3. Binding of MF1 to tubulin.
(A) Fraction bound MF1 with increasing tubulin heterodimer concentrations. Data was fit to a hyperbola, yielding Kd = 1.7 ± 0.5 μM. Data represent five independent experiments. (B) Data in A were obtained from SDS-PAGE of pellets from a representative cosedimentation experiment. Sample 10(2) shows the cosedimentation of unbound MF1 to microtubules after initial binding assay. Microtubule binding assays were performed by mixing increasing μM concentrations of tubulin (Cytoskeleton (Denver, CO) or gift from Dr. Holly Davidson, Notre Dame) with 2.5 μM MF1 in 10 mM PIPES, 5 mM MgCl2, 1 mM EGTA, pH 7.0 buffer, incubated for 30 min at room temperature, followed by centrifugation at 90,000 x g for 10 min at 25°C to pellet the tubulin-MF1 complex. The pellet was resuspended in 10 mM PIPES, 5 mM MgCl2, 1 mM EGTA, 5 mM CaCl2 pH 7.0 at 4°C, allowing MTs to depolymerize. Supernatant and pellet samples were run on 10% SDS-PAGE gels that were stained with Coomassie G. Band intensities were analyzed by densitometry using Image J.

