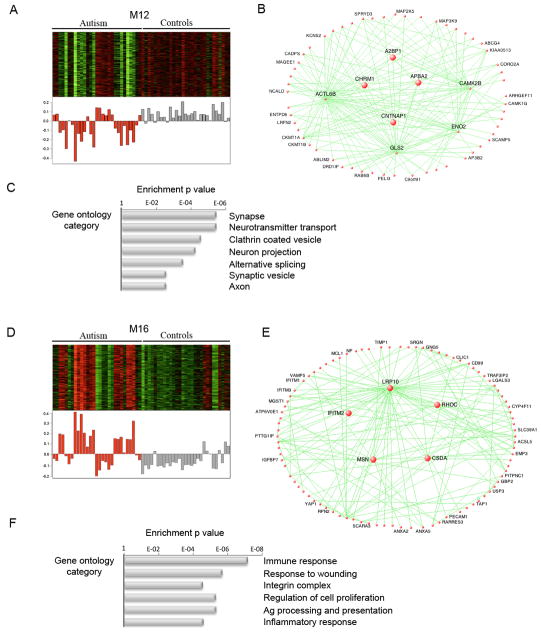
Figure 2. Gene co-expression modules associated with autism.
A, D Top-heatmap of genes belonging to the co-expression module. Bottom-corresponding module eigengene values (y-axis) across samples (x-axis) . Red-autism, grey-controls.
B, E Visualization of the M12 and M16 modules respectively. The top 150 connections are shown for the each module. Genes with the highest correlation with the module eigengene value (i.e intramodular hubs) are shown in larger size.
C, F Relevant gene ontology categories enriched in the M12 and M16 modules

