
Figure 4. GWAS set enrichment analysis.
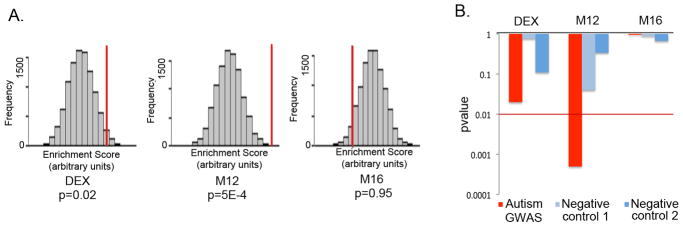
A. GWAS set enrichment analysis using the discovery AGRE cohort from Wang et al.27 For each gene set (DE genes, M12 and M16) the null distribution of the enrichment score generated by 10000 random permutations is shown (x-axis) and the enrichment score for the gene set is depicted by a red vertical line. A p value < 0.01 was considered significant to correct for multiple comparisons.
B. GWAS signal enrichment of DE genes and the autism-associated co-expression modules M12 and M16. Enrichment p values are shown for an autism GWAS dataset (Wang et al.27, AGRE discovery cohort) as well as two control datasets consisting of GWAS studies of non-psychiatric traits: Han et al.23 (Negative control 1) and Cooper et al.24 (Negative control 2). The red line marks the p value threshold for significance.