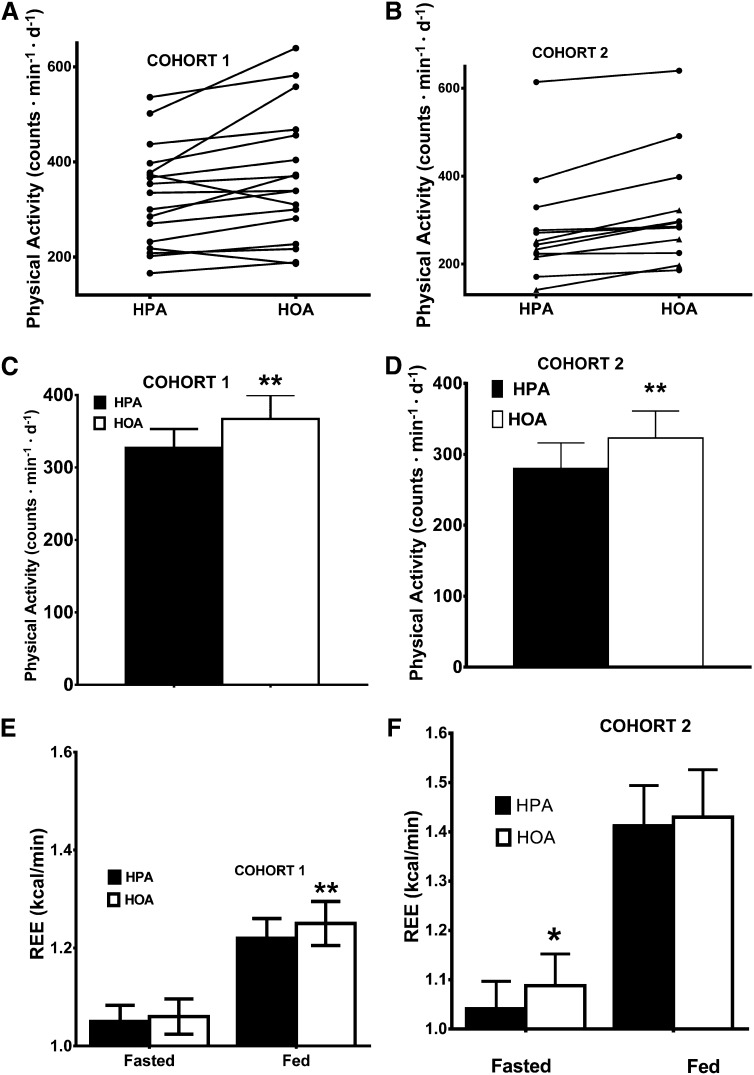
FIGURE 1.
Physical activity and REE. A and B: Effects of diet condition on individual changes in physical activity during the 2 experimental diets. Diet effects were analyzed by using Wilcoxon's signed-rank test in cohorts 1 (n = 17; P = 0. 008) (A) and 2 (n = 12; P = 0.005) (B). Lean subjects are designated by circles, and obese subjects are designated by triangles. Effects of diet condition on average (mean ± SEM) physical activity were calculated in cohorts 1 (HPA: 327 ± 26 counts · min−1 · d−1; HOA: 367 ± 33 counts · min−1 · d−1) (C) and 2 (HPA: 280 ± 36 counts · min−1 · d−1; HOA: 323 ± 38 counts · min−1 · d−1) (D). Diet effects were analyzed by using a repeated-measures ANOVA, including sequence and treatment effects, with the baseline value as a covariate. Effects of diets on mean (±SEM) REE (kcal/min) in the fasted and fed state were calculated in cohorts 1 (n = 18; HPA: fasted, 1.05 ± 0.03 kcal/min; fed, 1.22 ± 0.04 kcal/min; HOA: fasted, 1.06 ± 0.04 kcal/min; fed, 1.25 ± 0.04 kcal/min) (E) and 2 (n = 11; HPA: fasted, 1.04 ± 0.06 kcal/min; fed, 1.41 ± 0.08 kcal/min; HOA: fasted, 1.09 ± 0.06 kcal/min; fed, 1.43 ± 0.10 kcal/min) (F). *,**Diet effect, *P ≤ 0.05, **P ≤ 0.01. HOA, high–oleic acid diet; HPA, high–palmitic acid diet; REE, resting energy expenditure.

