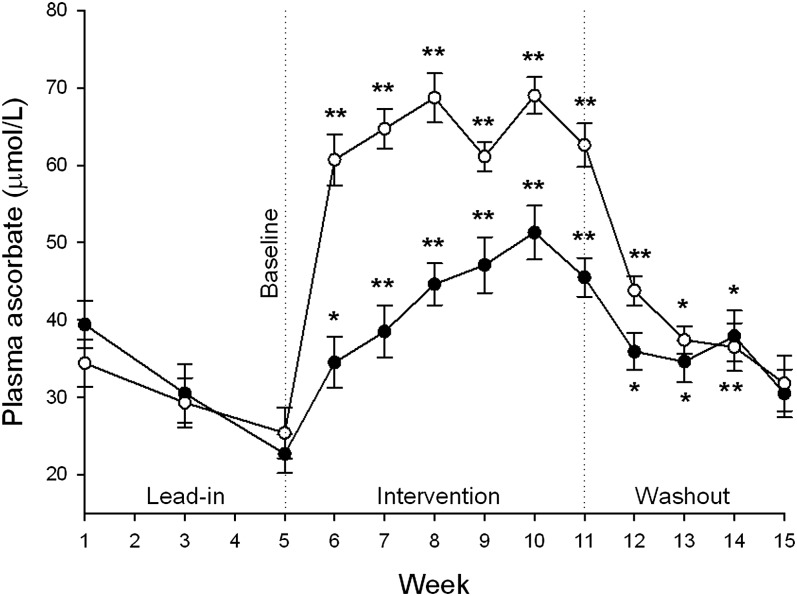
FIGURE 2.
Mean ± SEM plasma ascorbate concentrations in the 0.5-kiwifruit/d (•; n = 18) and 2-kiwifruit/d (○; n = 17) groups during the lead-in, intervention, and washout phases of the study. Significant differences (P < 0.001) were observed between the 2 interventions from weeks 6 to 11; no differences were observed during the washout phase. *,**For comparison with baseline (week 5; 2-factor ANOVA with Fisher's pairwise multiple-comparison procedure): *P < 0.01, **P < 0.001.

