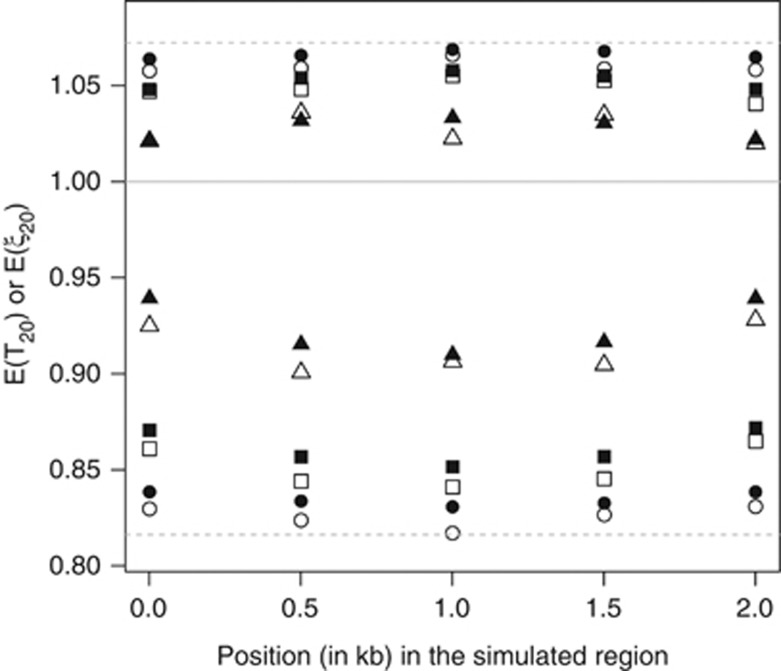
Figure 3.
E(T20) and E(ξ20) across a region where the selective effects vary across sites. The population is assumed to be at statistical equilibrium. The simulated region is composed of 2001 sites. For each triplet of sites, the first two sites are subject to selection with γ1=Ns1=20 and γ2=Ns2=50, respectively, whereas the third site is assumed to be neutral. The scaled mutation is θ=Nu=0.005 per site. The level of recombination is measured by r/u, where r is the per-site recombination rate. Simulations have been conducted with r/u=5, 1 and 0.25, with the corresponding results represented by triangles, squares and circles, respectively. Among the results represented by symbols of the same shape, those placed above one are for E(ξ20), whereas those placed below are for E(T20). Filled and open symbols show estimates obtained from coalescent and forward simulations, respectively. The dashed lines at the top and bottom of the figure show values of E(ξ20) and E(T20) when r/u=0, respectively.

