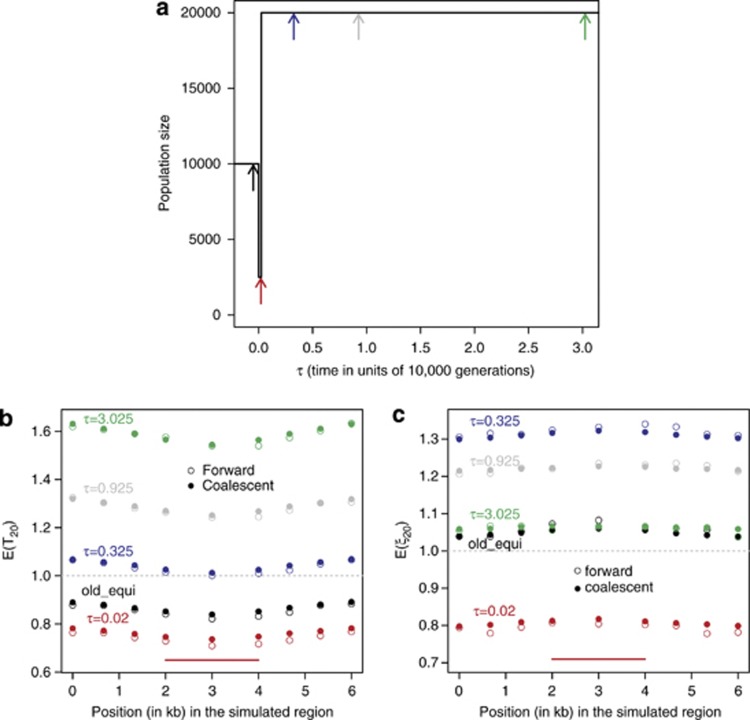
Figure 4.
Patterns of diversity in a region under background selection during the course of a population bottleneck event. Initially, the population is at equilibrium with N=10 000. Let τ denote the time measured in units of 10 000 generations. As shown in (a), the population size decreases instantly to 2500 at τ=0 and increases instantly to 20 000 at τ=0.025. Random samples of size 20 were simulated at the five time points indicated with the coloured arrows in (a). The simulated region is composed of a centrally located selected region with 2001 sites, as indicated with the horizontal red lines in (b) and (c), and two flanking, neutrally evolving regions with 2000 sites each. The organization of the selected and neutral sites within the selected region is the same as that described in Figure 3 (that is, K=2, L1=L2=667). Scaling by N=10 000, γ1=20, γ2=50 and θ=0.005 per site. The per-site recombination rate r is equal to 0.5u. Estimates of E(T20) and E(ξ20) are shown in (b, c), respectively. In these two plots, open and filled symbols indicate results obtained from forward and coalescent simulations, respectively.

