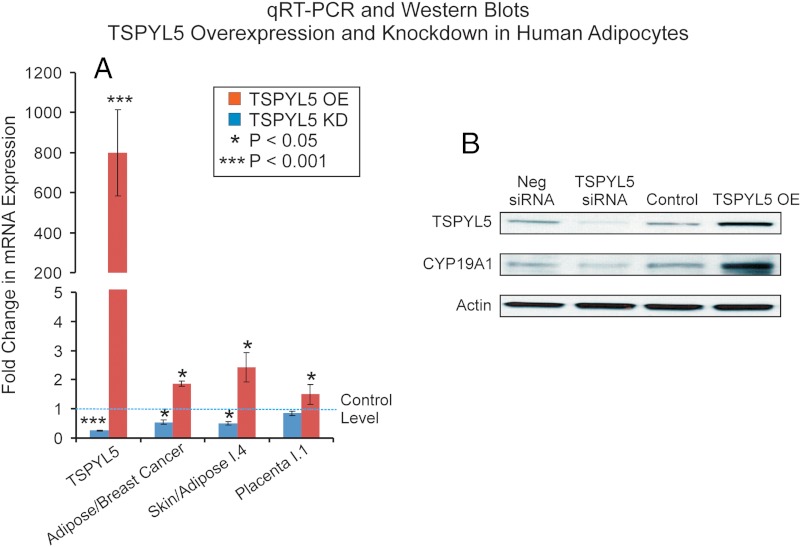
Figure 5.
A, TSPYL5 and CYP19A1 mRNA expression levels after TSPYL5 overexpression (OE) (red bars) and knockdown (KD) (blue bars) in HO3sD-96Wa human adipocytes. B, Western blot analysis of TSPYL5 and CYP19A1 protein levels after TSPYL5 OE or KD in HO3sD-96Wa human adipocytes. *, P < .05; **, P < .01. Neg, negative.

