
Figure 6.
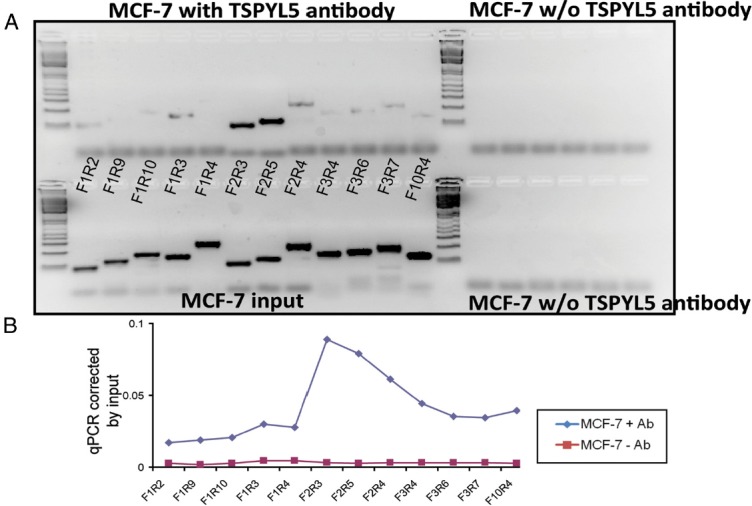
ChIP Assays in MCF-7 Cells Using TSPYL5 Antibody. A, The upper panel shows PCR amplification after ChIP assay using different primer pairs within the skin/adipose promoter region of the CYP19A1 gene in MCF-7 cells. B, The lower panel shows qPCR quantification of the same ChIP assay shown in panel A. Ab, Antibody; w/o, without.