
Figure 7.
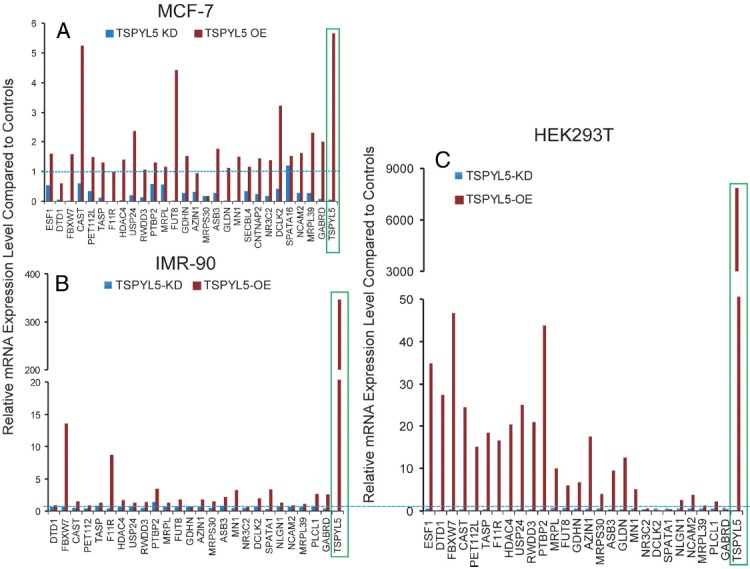
Effect of TSPYL5A Overexpression (OE) and Knockdown (KD)on the Relative mRNA Expression of Genes That Contain the Putative TSPYL5 DNA Binding Motif in (A) MCF-7, (B) IMR-90, and (C) HEK293T Cells. Red bars represent data for TSPYL5 overexpression and blue bars represent data for TSPYL5 knockdown. The blue dash lines represent control levels of expression.