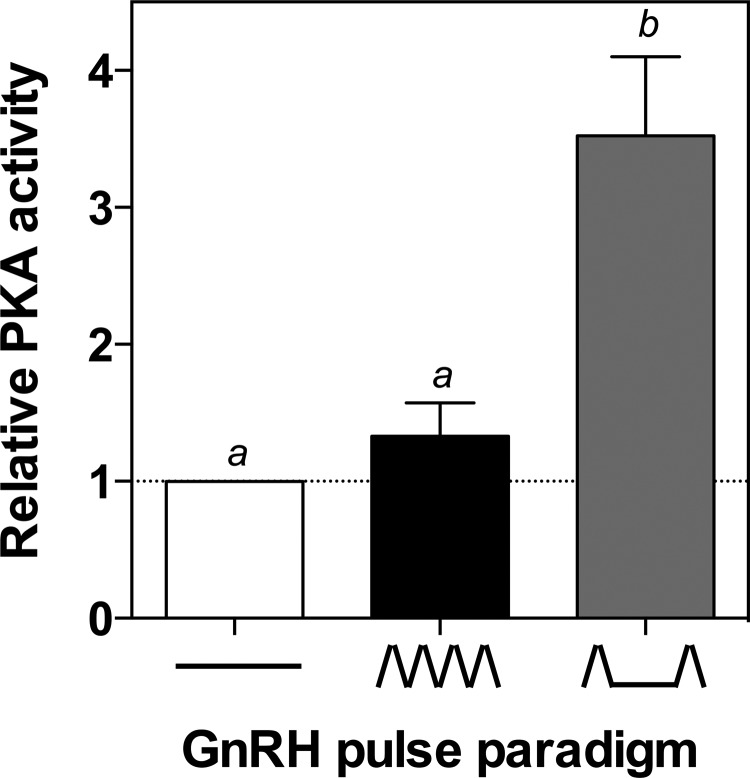
Figure 6.
GnRH Induction of PKA Activity Is Stimulated at Low GnRH Pulse Frequencies. LβT2 cells were perifused for 20 h with high (ΛΛΛΛ; every 30 min) or low (Λ__Λ; every 120 min) frequencies of GnRH or medium alone (____), after which PKA activity was measured. The bar graph shows relative change compared with basal control samples (mean ± SEM from three independent experiments, each performed in triplicate). Significant differences (P < .05), measured by one-way ANOVA with a post hoc Tukey multiple-comparison test, are indicated by different letters.

