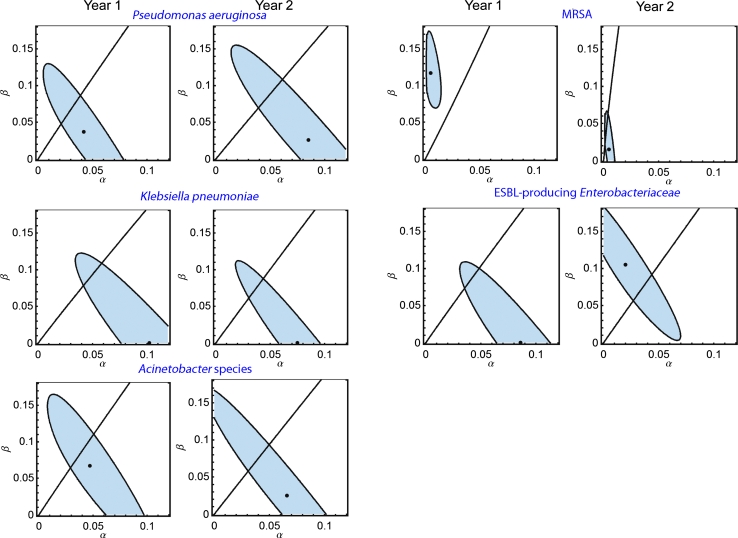
Fig. 2.
Contour plots of the likelihood of the acquisition parameters α (endogenous acquisition, horizontal axis) and β (exogenous acquisition, vertical axis) for Pseudomonas aeruginosa, gentamicin-resistant Klebsiella pneumoniae, amikacin-resistant Acinetobacter spp., methicillin-resistant Staphylococcus aureus (MRSA), extended spectrum beta-lactamase-producing Enterobacteriaceae (excl. K. pneumoniae) (ESBL-producing Enterobacteriaceae) in year 1 and year 2. The black dot represents the maximum likelihood estimate (MLE), the shaded area represents the corresponding 95 % confidence interval (CI). The line represents the parameters for which the endogenous route and the exogenous route are equally important. For example, the MLE of exogenous acquisition parameter β of MRSA was 0.117 (95 % CI 0.079; 0.162) in year 1 and 0.015 (0.0; 0.055) in year 2, indicating that the probability of exogenous acquisition of MRSA per unit of time for a given prevalence of MRSA on the ward was 8 (0.117/0.015) times lower in year 2 compared to year 1. In contrast, the MLEs of endogenous acquisition parameter α were both 0.005 (95 % CI 0.002; 0.012 and 0.002; 0.009) in year 1 and year 2, indicating that the daily probability of endogenous acquisition of MRSA remained 0.5 % throughout the entire study period

