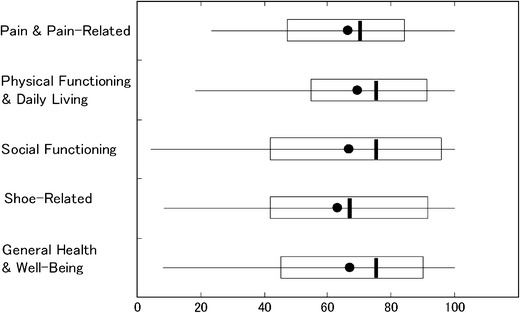
Fig. 1.

Subscale score distributions. Left and right rectangle edges indicate the 25th and 75th percentiles. Vertical lines within the rectangles show the medians. Bullet marks indicate the means. Left and right ends of the horizontal lines passing through the rectangles represent the 5th and 95th percentiles
