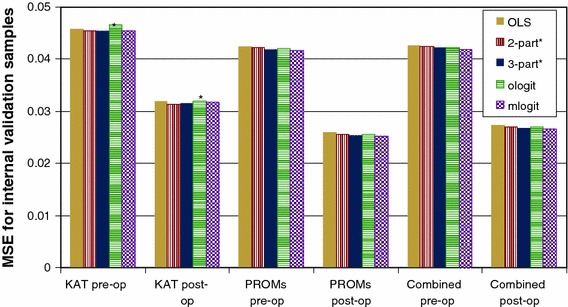
Fig. 2.

Mean squared error (MSE) for models fitted on each dataset. Models were tested in their respective internal validation samples: for example, the performance of models estimated using KAT was tested on 25 % of the KAT sample. *Levels 0/1 (or levels 3/4) were merged for one or more OKS item in logistic regression models as problems with perfect prediction or non-symmetric/highly singular variance matrices arose with the first-part model when all response levels were included
