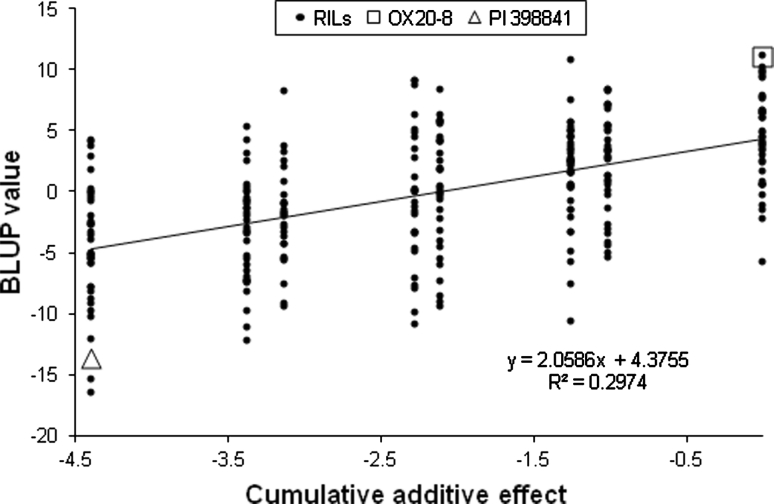
Fig. 3.
Regression of the BLUP values on cumulative additive effects of pyramiding resistance alleles for QTL conferring partial resistance to P. sojae identified in this study. The accumulative additive effects were calculated based on three QTL, QTL-1, -13, and -18. X-axis indicates the sum of additive effects of combined resistance alleles for QTL in each RIL and two parental lines and Y-axis indicates BLUP values of parents and RILs. Lower BLUP values mean higher levels of resistance. The additive effects of resistance alleles for the three QTL identified in this study have negative values. The equation and R 2 of the regression line are shown on the scatter plots. The BLUP values of OX20-8, PI 398841, and RILs are plotted as square, triangle, and black circles

