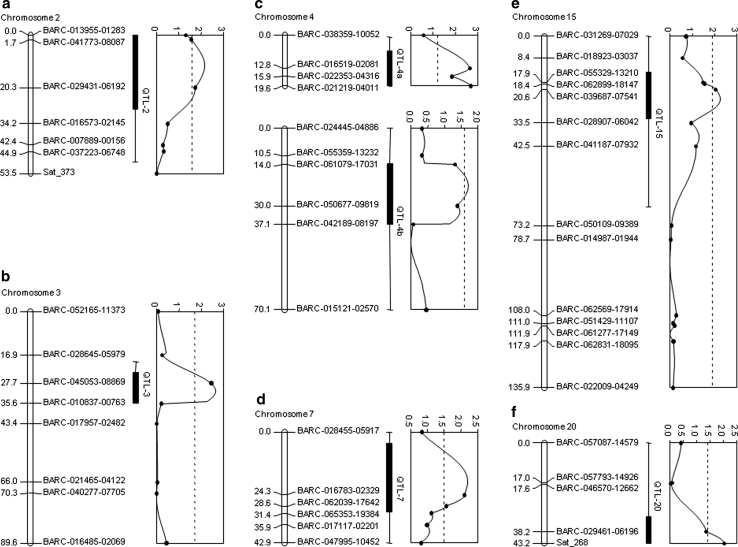
Fig. 4.
Graphical presentations of seven additional quantitative trait loci for partial resistance to P. sojae identified using chromosome-wide LOD thresholds in the F7:8 RIL population derived from a cross of OX20-8 × PI 398841. Genetic distance (cM) and marker names are shown to the left and right of chromosomes, respectively. The LOD plots to the right of chromosomes indicate the most likely position of QTL conferring partial resistance to P. sojae. The hatched lines on the LOD plots indicate the chromosome-wide LOD threshold for CIM. The 1- and 2-LOD intervals are displayed as black bars and solid lines, respectively

