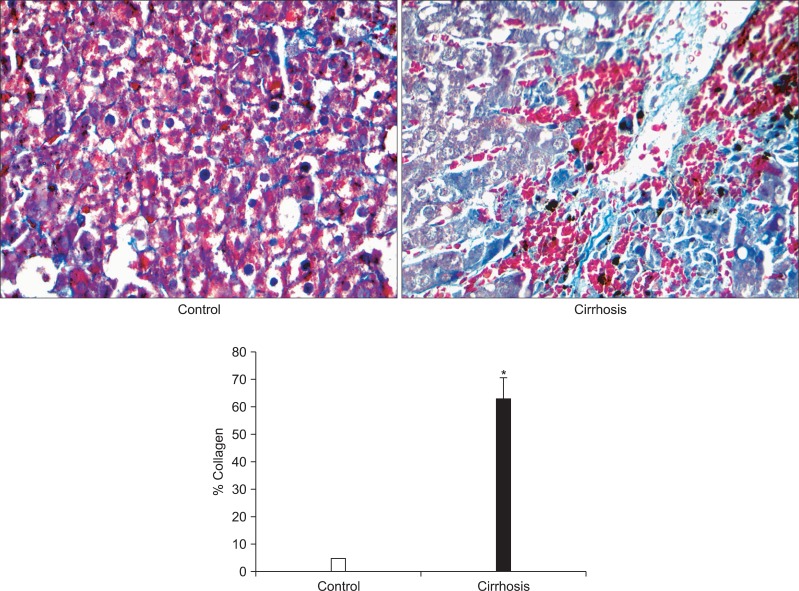
Fig. 1.
Change in the percentage of collagen in liver sections between normal and cirrhotic samples. Representative results of Manson's trichrome stain were conducted in both samples (×400). The quantitative results of the section staining were analyzed using Motic Fluo 1.0 software (Motic Instruments Inc.). Data are presented as mean±SEM deviation and analyzed with the SPSS version 13.0 statistical package (SPSS Inc.) using the two independent sample t-test. *p<0.001 vs control.

