
Figure 3.
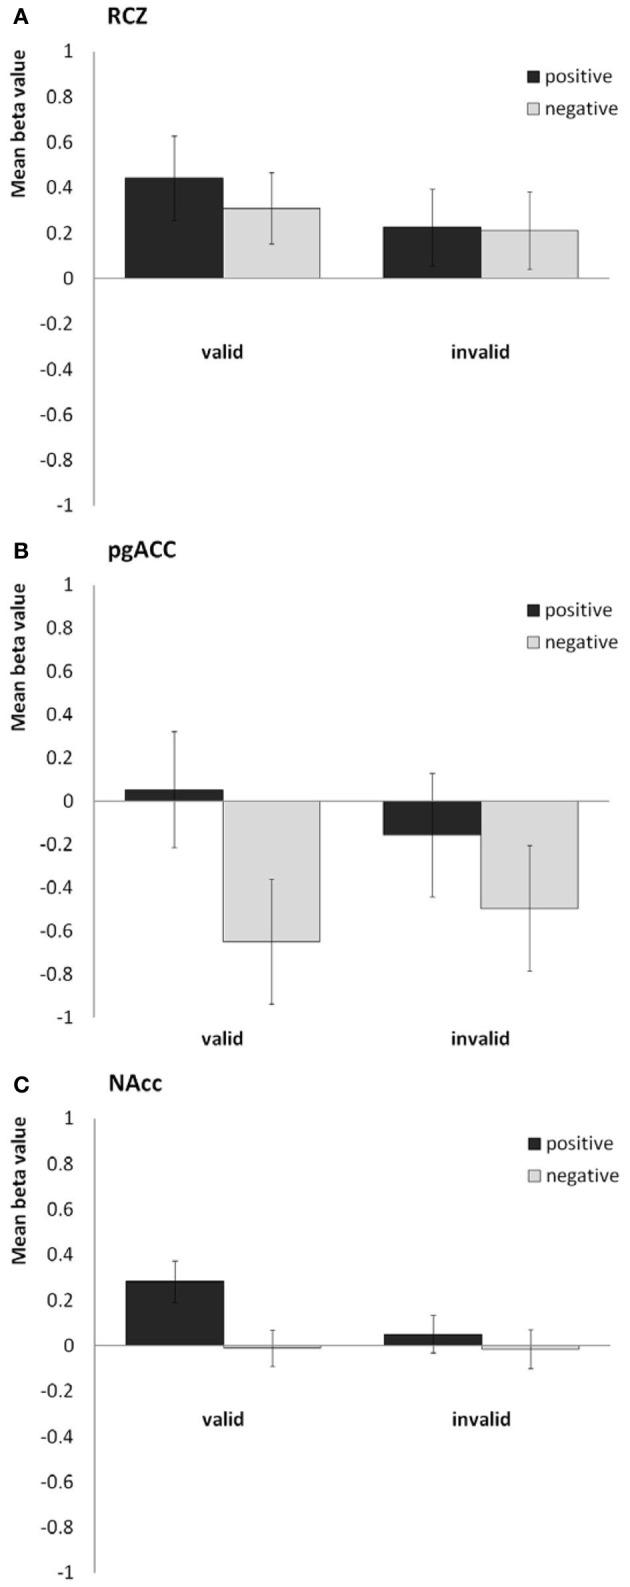
Bar plots showing the mean beta values for the four predictors (valid positive, valid negative, invalid positive, and invalid negative) for (A) the rostral cingulate zone (averaged across the right and left hemisphere), (B) the pregenual anterior cingulate, and (C) the nucleus accumbens (averaged across both hemispheres).