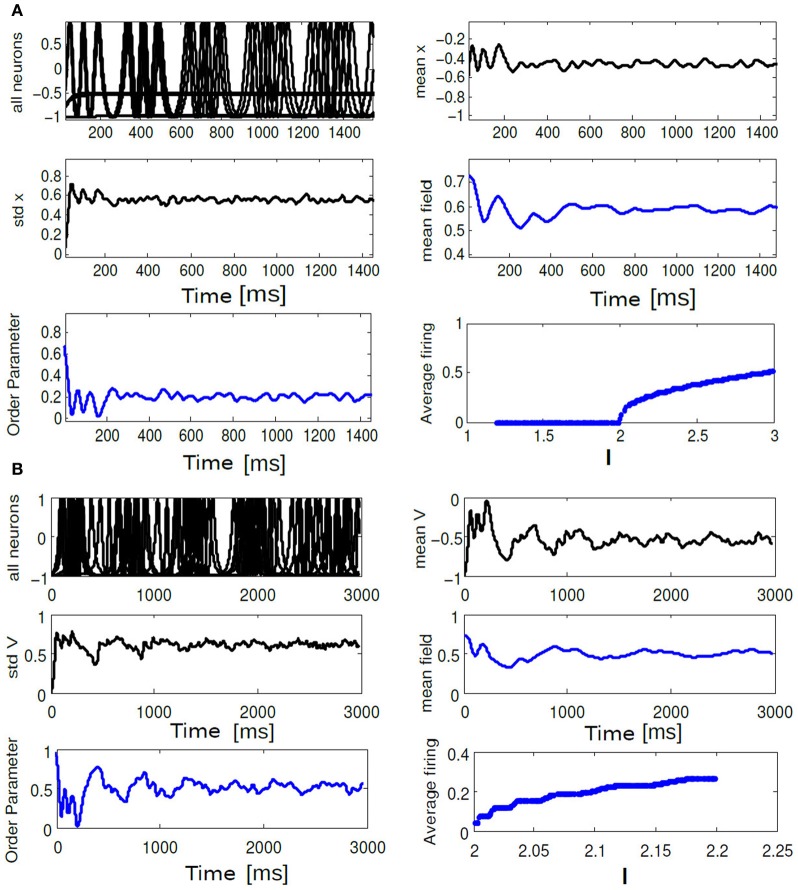
Figure 10.
In (A) time evolution of Vi(t), std Vmean, order parameter Rθ(t), Vmean, mean field Γ, Average frequency are shown for the choice of K = 0.6, ΔI = 0.3. In (B) time evolution of the same quantities are shown for K = 0.01, ΔI = 0.1. In (A), average firing frequency plot shows clusters of neurons firing incoherently while another cluster of neurons are completely silent. In (B) same subfigure shows a monotonic increase in average firing frequency.

