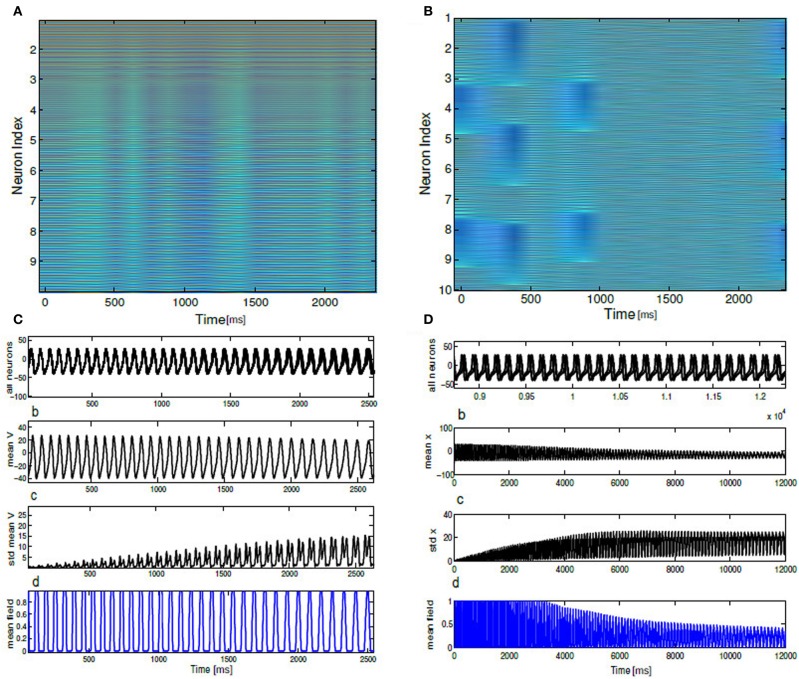
Figure 4.
Array diagrams are shown in (A,B) for two distinct network states. In a nearly coherent states with clusters of synchronous bursting activity ΔI = 0.001, K = 0.7, in (B) incoherent states for ΔI = 0.12, K = 0.01. Nearly coherent states showing dynamical clustering effects and wave-like activity spread. Membrane potential time series is shown for all the neurons exhibiting spiking dynamics both in the coherent and incoherent states. Mean membrane potential amplitude decreases and converge to a stationary solution. Standard deviation shown in (C,D) shows growth in time. Mean field traces shows periodic activation and deactivation in the coherent state. In the incoherent state mean field amplitude systematically decrease in time.

