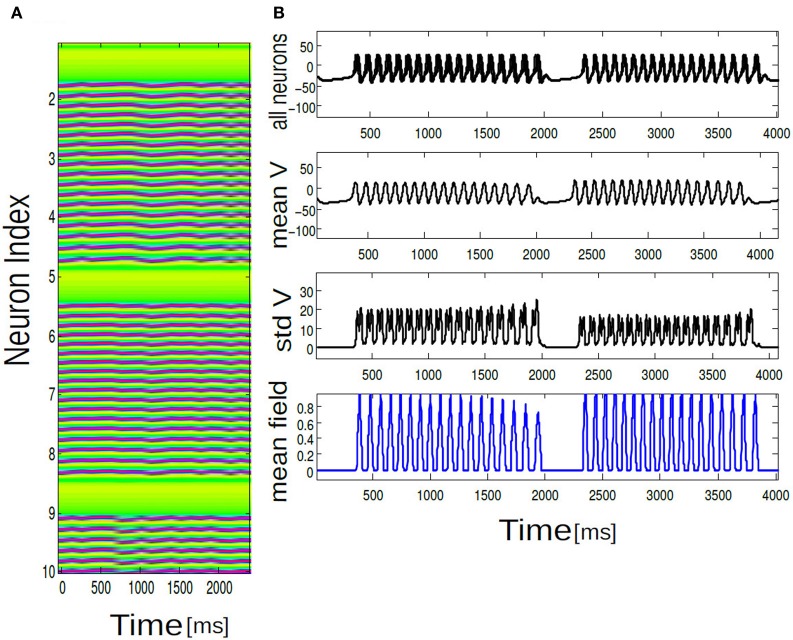
Figure 5.
In (A) array diagram showing firing pattern in a population of 100 neurons. Only 10 neuron index are shown for clarity. Horizontal axis is always time and vertical axis is labeled as neuron index. Green color corresponds to no firing activity or quiescence. Purple pixels corresponds to parabolic bursting activity of each individual neurons which are locked in time. In (B) time series data for membrane potential of V(t), Vmean(t), Γ(t), and std Vmean(t) are plotted for 10 neurons. Mean population burst synchronizes in time.

