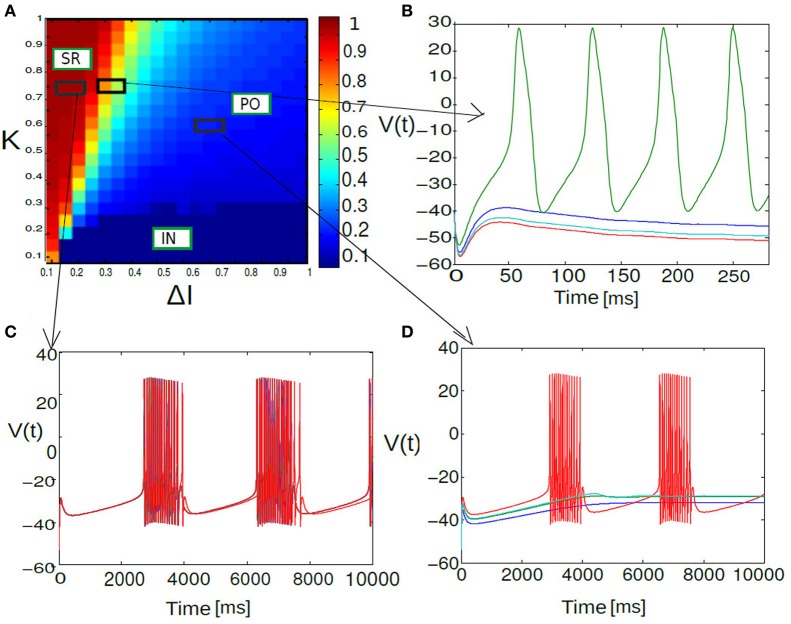
Figure 6.
Phase diagram of mean synaptic action variable is shown as a function of 2D parameter space of stimulus spread ΔI and excitatory coupling strength K. In the partial burst regime labeled as PO in (A), a subset of neurons are not firing at all as their respective drives are below their individual firing thresholds. Heterogeneous dynamics between synchronized population spiking activity and oscillation frequency death response for PO state is displayed in (B). Nearly synchronized population of spike/burst activity lumped in a regime labeled as SR [corresponding time series is displayed in (C)] and incoherent population spike/burst activity is lumped into a regime called IN. In the incoherent regime mean field values stay close to zero with substantial subthreshold fluctuations. In (D) multi stability of PO state is displayed again; now between population burst and fixed point dynamics for an entirely different parameterization.

