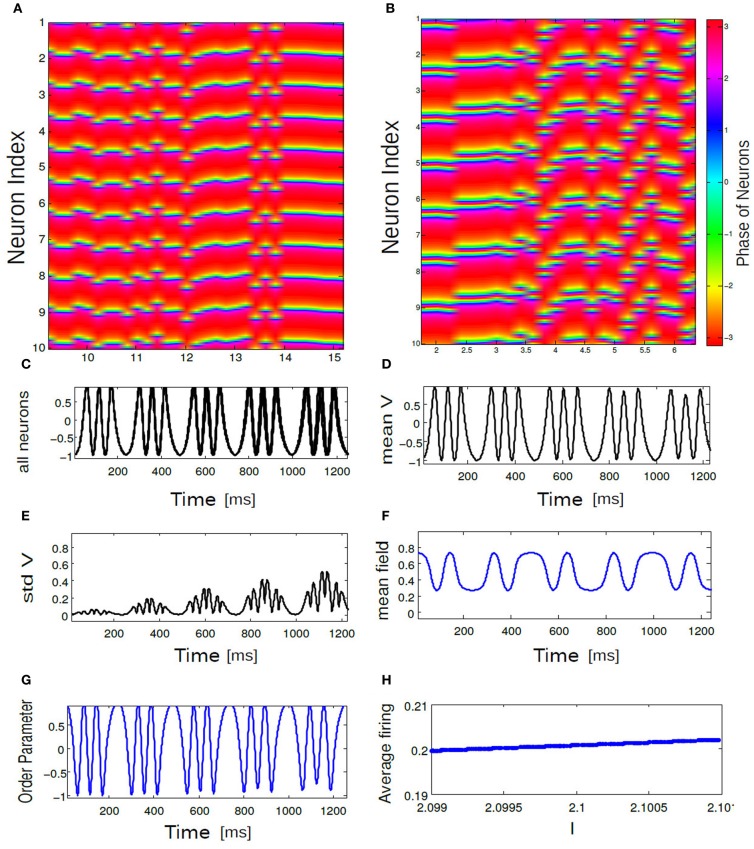
Figure 9.
In (A,B) an array diagram is shown for phase network model for a parameter combination. In (A) K = 0.61, ΔI = 0.001, n = 1 spikes only and in (B) K = 0.001, ΔI = 0.15, n = 3 bursts only. Almost always, near synchronous burst states are observed for high K and low ΔI values. In (C) corresponding time evolution of Vi(t) is shown for all 10 bursting neurons. In (D) temporal response of Vmean is shown for the coherent state of our network. In (E) standard deviations of Vmean is plotted as a function of time. In (F) mean field Γ vs. time for the coherent state is shown. (G) displays temporal dynamics of order parameter. Average firing frequency as described in Equation (14) is plotted in (H) for the parameter combination of K = 0.001, ΔI = 0.15. Panel (H) further demonstrates phase locking behavior among all the neurons.

