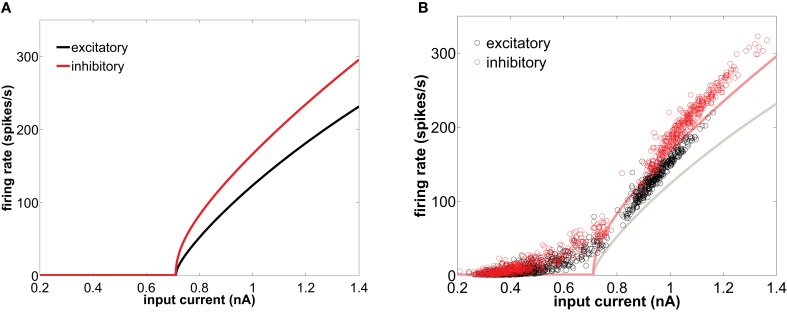
Figure 1.
(A) f-I curve of type I conductance-based neurons in isolation, obtained with the XPPAUT software (Ermentrout, 2002). (B) Equivalent f-I curve for neurons embedded in the network (circles) representing the instantaneous firing-rate versus the net synaptic current averaged over the corresponding inter-spike interval, for an excitatory (black) and inhibitory (red) neuron. In that panel the single-neuron f-I curves are also shown in solid lines for comparison. The network is excited by a train of spikes of rate 8500 spikes/s.

