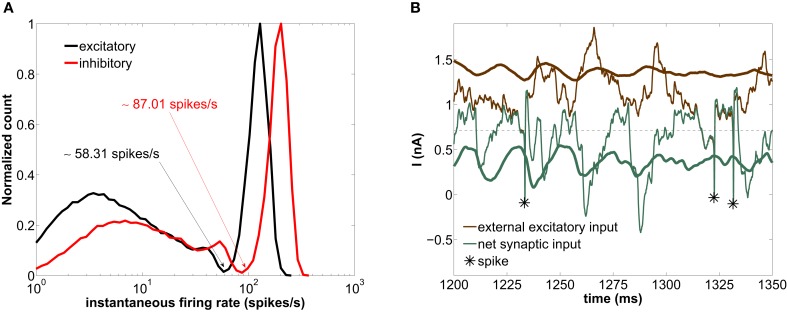
Figure 4.
Modeled network with a GABAergic decay time constant τd = 5 ms. (A) Histogram of instantaneous firing-rates of both excitatory (black) and inhibitory (red) neurons. The arrows point at the minimum of the distribution separating the fast and slow firing mode. (B) Time trace of the external excitatory current (brown lines) and the net synaptic current (green lines) acting upon the excitatory neurons. The thick lines are averages over the entire excitatory population, whereas the thin lines correspond to the current impinging on a single neuron. The asterisks label the spiking times of this neuron. The horizontal dashed line marks the spiking threshold, i.e., the value of I at the bifurcation of Figure 1A.

