Figure 5.
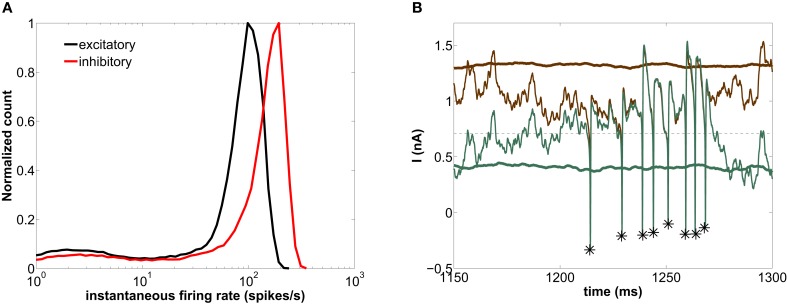
Modeled network with τd = 30 ms. (A) Histogram of instantaneous firing-rates of both excitatory (black) and inhibitory (red) neurons. (B) Time trace of the external excitatory current (brown lines) and the net synaptic current (green lines) acting upon the excitatory neurons. See caption of Figure 4 for more details on this plot.

