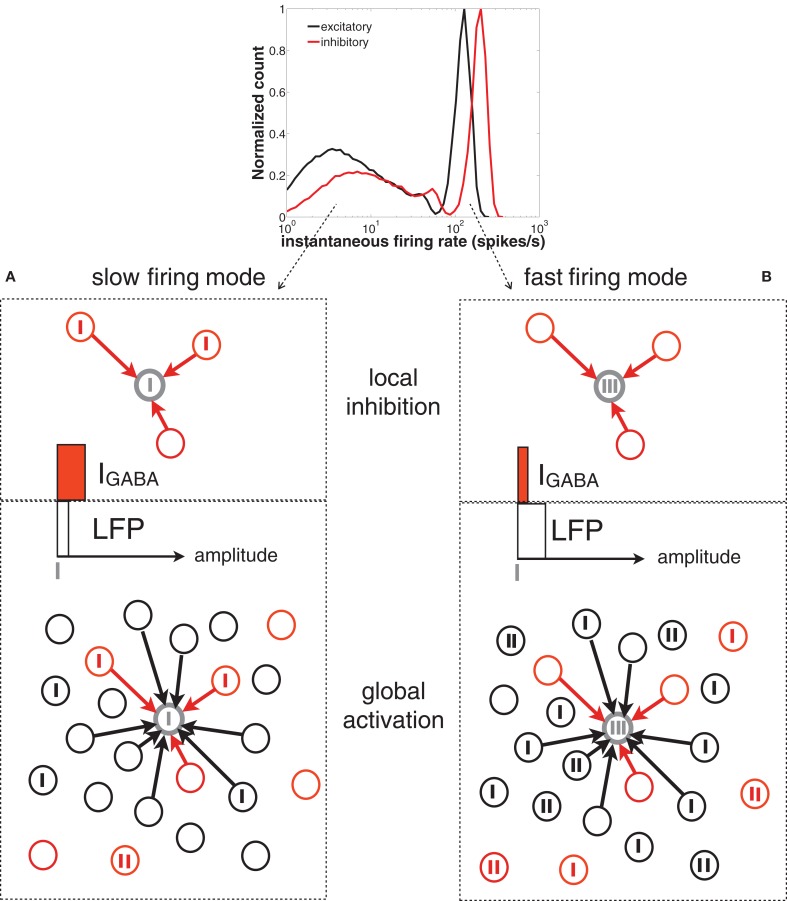
Figure 8.
Scheme of the network spiking activity underlying slow (A) and fast (B) firing modes of a given neuron in the network (represented by the gray circle). Vertical thick ticks represent spikes. The black and red circles represent excitatory and inhibitory neurons, respectively. For simplicity, only contacts to the gray neuron are represented (black arrows). In the top panel of (A) (slow firing mode), the reference neuron (in gray) is surrounded by presynaptic inhibitory neurons that are starting to fire (i.e., the level of IGABA, represented by a horizontal red bar, is moderate). The global activity of the network (bottom panel, represented by a white horizontal bar) is low and the earliest inhibitory spikes prevent the cells from bursting. In the top panel of (B) (fast firing mode) the neuron is surrounded by inactive inhibitory neurons (i.e., the level of IGABA is low), whose silence is driven by the high activity of the rest of the inhibitory population (reflected in a high level of the LFP).

