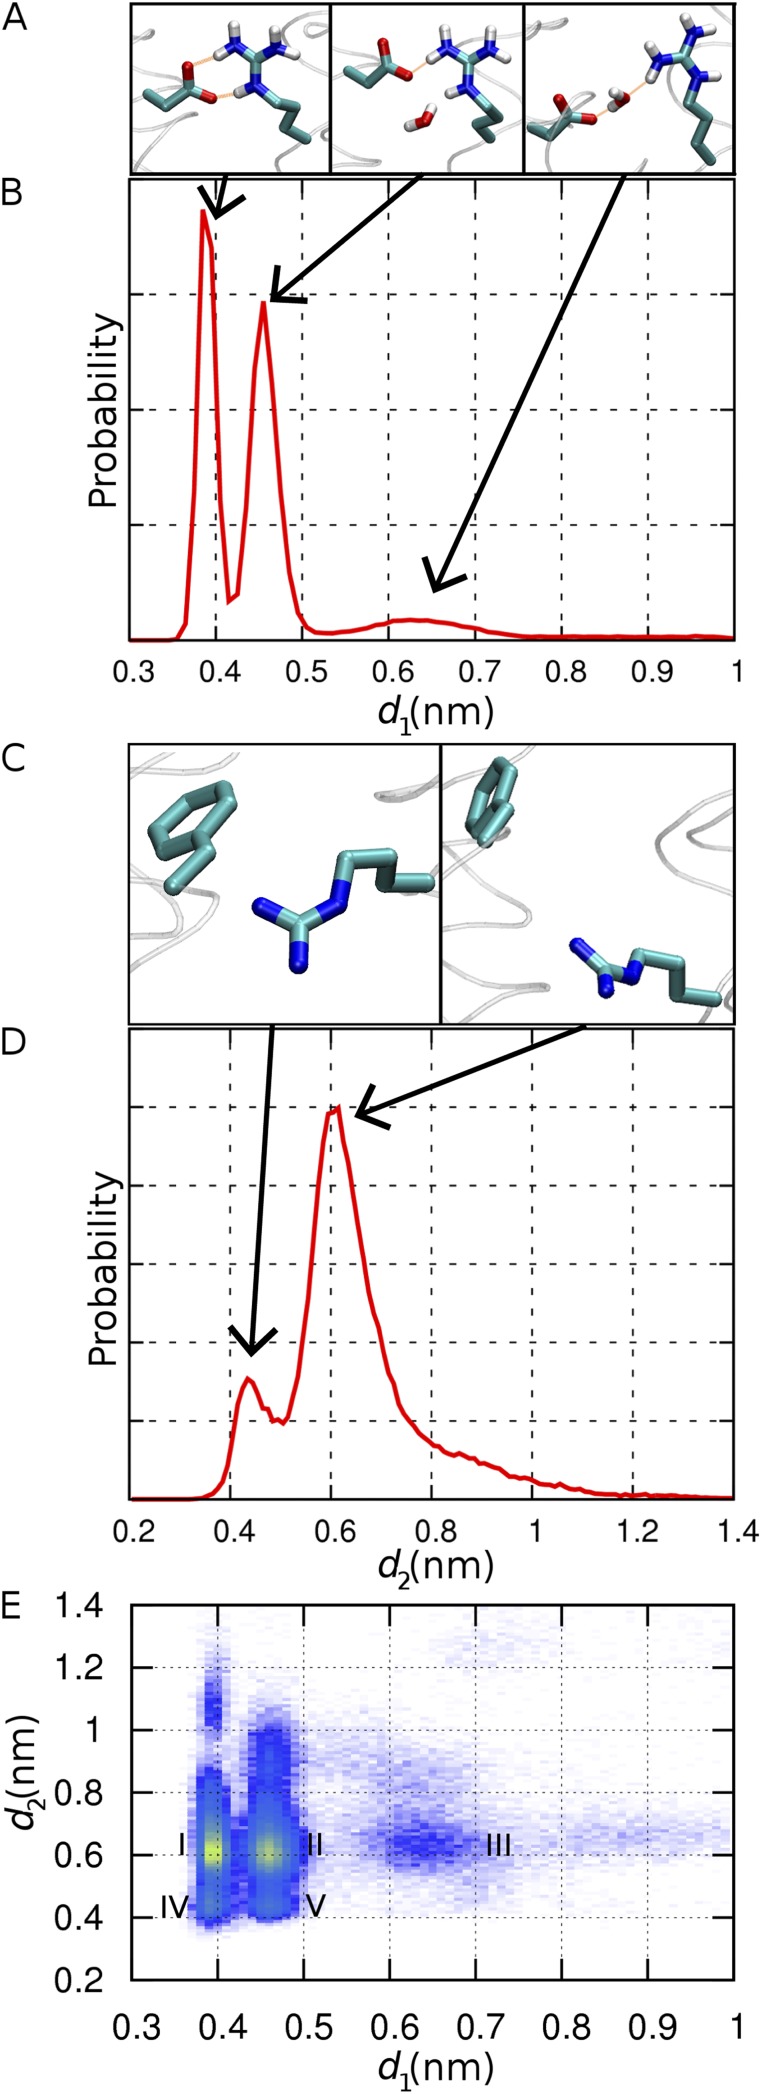
Figure 7.
Structural fluctuations of the two channel constrictions in model R2D. (A) Configurations of the D112–R208 salt bridge (from left to right: bidentate, monodentate, and open). Hydrogen bonds are shown as orange lines. (B) Probability distribution of d1, the distance between atom Cγ of D112 and atom Cz of R208. (C) Closed (left) and open (right) conformations of F150 and R211. (D) Probability distribution of d2, the distance between the center of the benzyl ring of F150 and atom Cz of R211. (E) Two-dimensional probability distribution of d1 and d2, with increasing probability from purple to yellow.

