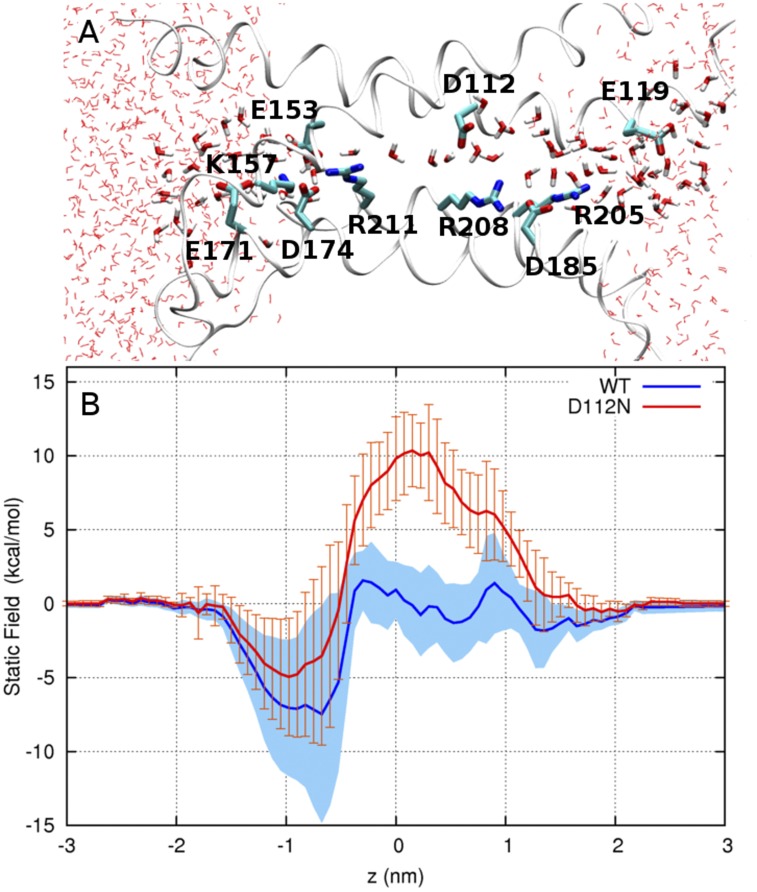
Figure 9.
Effect of the charge distribution of the channel on the energetics of ion translocation. (A) Representative snapshot of the water-filled open conformation of HV1. Water molecules and charged residues in the pore are shown in licorice representation; the extracellular end is to the right. (B) Static field energy for the transfer of a positive point charge in (blue) WT and (red) neutral-D112 forms of HV1. Two thick lines represent the mean of five running averages, each computed from a dataset of 30 snapshots using a five-point moving window. Blue shading and orange error bars represent the SEM.

