Figure 3.
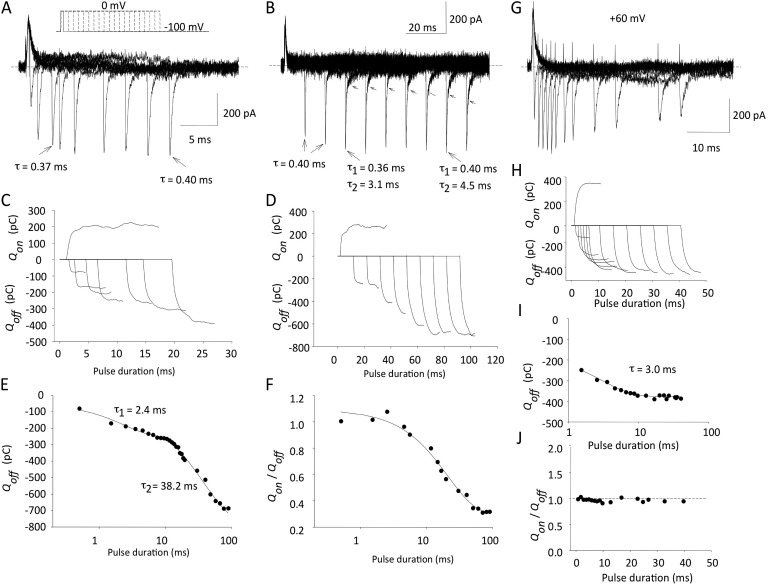
Repolarization envelopes separate two components of charge moved at 0 mV, but not at +60 mV. (A and B) Illustrative currents obtained using an envelope of tails protocol. Membrane potential was stepped to 0 mV from −100 mV for varying durations of time (A, 1-ms intervals; B, 10-ms intervals) and repolarized back to −100 mV. Note that for shorter pulses, Igoff decay was best fitted with a single exponential, whereas longer pulses led to the appearance of a second, slower component (highlighted with arrows; time constants obtained using single or double exponentials are shown). (C and D) Qon and Qoff for pulses to 0 mV from integration of current tracings in A and B. Note Qoff increase after depolarizing pulses longer than ∼20 ms. (E) Time constants for saturation of fast and slow phases of Qoff after pulses to 0 mV. (F) Change in Qon/Qoff ratio for pulses to 0 mV of increasing duration. (G–J) Same experiments as in A–F, but depolarizing pulses were to +60 mV.

