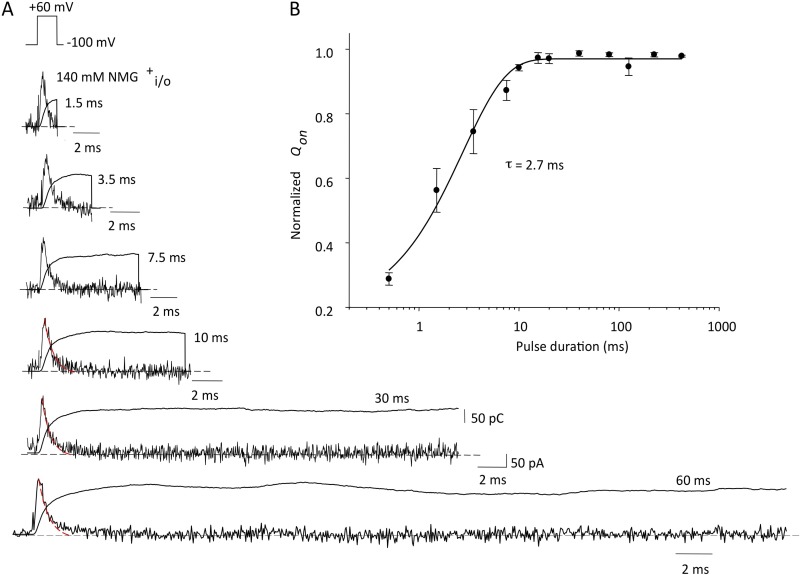
Figure 4.
Time courses of on-gating current and charge for depolarizations of increasing duration. (A) Original data illustrating Igon (noisy traces) and the integrals, Q, for depolarizations to +60 mV from −100 mV. Pulses were from 0.5- to 500-ms duration (1.5–60 ms illustrated); all tracings are on the same time base. Current and charge scaling bars apply to all records. Igon decays for 10-, 30-, and 60-ms pulses were overlain with a single-exponential decay function (red dashed lines) to show second, slower component of current decay. (B) Normalized charge versus pulse duration. Data were fit with a single-exponential function: τ = 2.7 ± 0.3 ms; n = 4.

