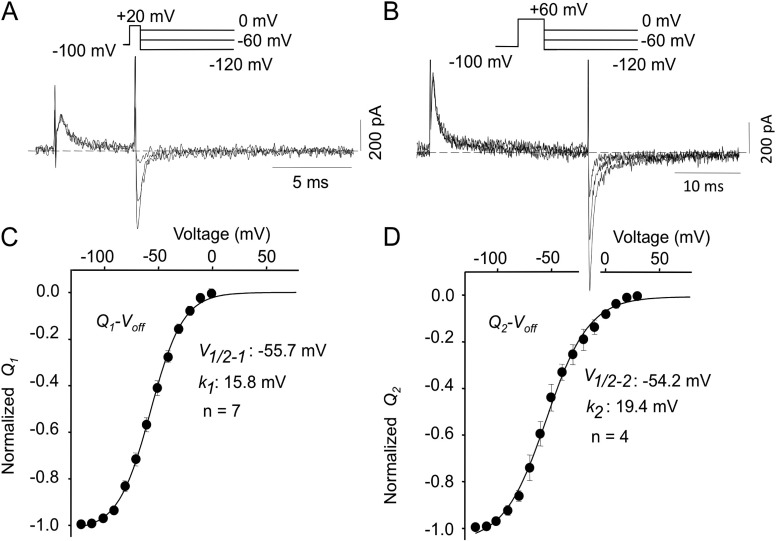
Figure 5.
Isolation of Q1 and Q2 Q-V relations. (A) Cells were pulsed from −100 to +20 mV for 5 ms before repolarizing to a range of potentials between 0 and −120 mV. Q1 charge was obtained by integrating off-gating currents after the 5-ms prepulse. (B) Measurement of total gating charge movement. Cells were pulsed from −100 to +60 mV for 24 ms before repolarizing to a range of potentials between +30 and −120 mV. (C) Q1 component of Q-Voff: V1/2–1 = −55.7 ± 2.4 mV and k1 = 15.8 ± 0.7 mV; n = 7. (D) Q2 charge was obtained by subtracting Q1 from total off-gating charge after 24-ms pulses to +60 mV; V1/2–2 = −54.2 ± 3.8 mV and k2 = 19.4 ± 1.8 mV; n = 4.

