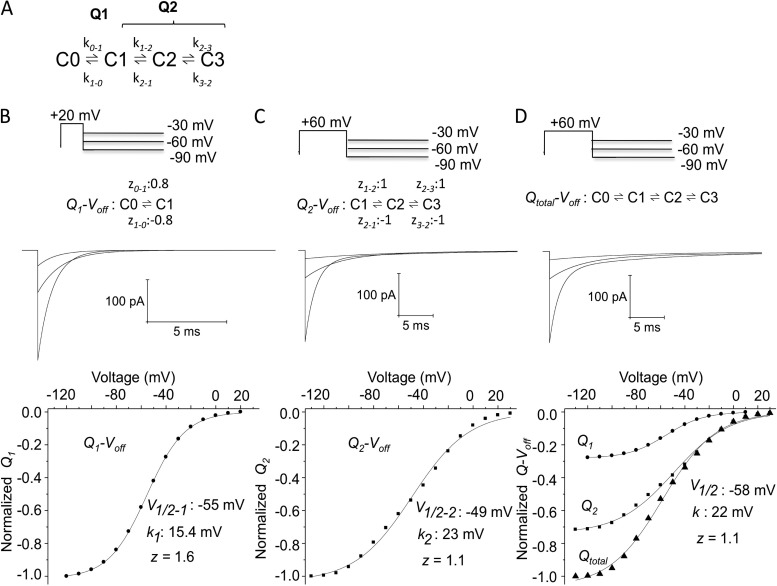
Figure 9.
Separation of charge systems: Q1 and Q2 can be represented by a four-state model. (A) Four-state model used to simulate the two charge components observed in hERG gating currents recorded from mammalian cells. Q1 was modeled based on the isolated Q1-Voff relation (z = 1.60; Fig. 5 A). Gating currents corresponding to Q1 charge movements were well represented by a two-state, voltage-dependent transition with forward and backward transitions of equal voltage dependence (z = 0.8). The determination of Q2 charge movement was based upon the charge distribution left after subtraction of the charge movements from the Qtotal (Fig. 5 B). The total equivalent charge for Q2 movement determined from the Boltzmann fit was similar to that of Q1, with z = 1.3 (Fig. 5 D). Q2 was modeled as two transitions, each with a total equivalent charge movement of z = 2. (B) Q1 simulations. Voltage-independent rate constants were adjusted by fitting the simulated gating currents to the Q1-Voff and V1/2 in Fig. 5 and had values of k0–1(0 mV) = 1,915 s−1 and k1–0(0 mV) = 58 s−1. Clamp protocols are as in Fig. 5 for repolarization steps to −30, −60, and −90 mV. Simulated currents are shown below, and the Q1-Voff relations are shown at the bottom. (C) Q2 simulation had voltage-independent rate constants of k1–2(0 mV) = 195 s−1, k2–1(0 mV) = 1.8 s−1, k2–3(0 mV) = 88 s−1, and k3–2(0 mV) = 7.9 s−1. (D) Qtotal simulation with Q1 and Q2 components displayed as in Fig. 6 B.

