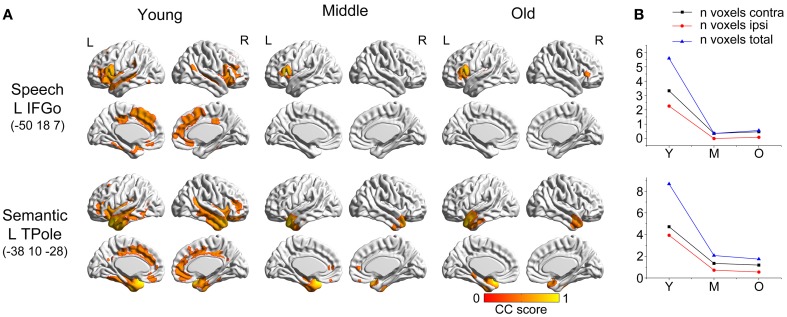
Figure 2.
Age-related changes in speech and semantic structural covariance networks. (A) Statistical maps of regions significantly correlated with the seed region in each group. The results are presented as correlation coefficient values (P < 0.05, FWE corrected). (B) The plots of voxel counts by group indicate abrupt contraction in the middle-aged group and mild changes in the old group. The y-axis represents the voxel number (x× 104).
Abbreviations
- IFGo
- inferior frontal gyrus, pars opercularis
- TPole
- temporal pole
- L
- left
- R
- right
- Y
- young group
- M
- middle-aged group
- O
- old group
- CC
- correlation coefficient.

