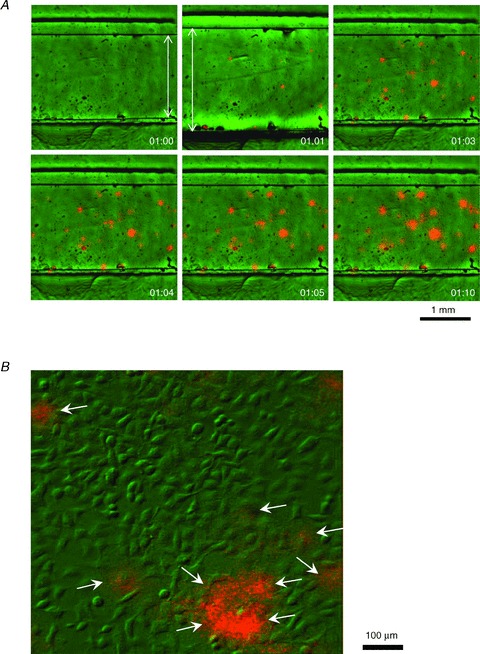
Figure 2. Stretch-induced ATP release sites are single cells.

A, typical stretch-induced ATP release from A549 cell culture recorded at low magnification with 4× objective. Pictures in the panel reveal sequential overlay of luminescence (orange) and IR images (green) of the stretch chamber with cells growing in the 2 mm wide groove. Images were taken before, during and after 1 s stretch of 21%, at the elapsed times (min:s) indicated in the lower right corner. Note the displacement of chamber groove edges during stretch (elapsed time 01:00 versus 01:01), flagged by arrows. ATP-dependent luciferase luminescence is seen at several discrete sites of cell culture after stretch, although some responses are already detectable during 1 s stretch. B, stretch-induced ATP release recorded at higher magnification with 20× objective. The image overlay (green, differential interference contrast IR image; orange, ATP-dependent luminescence) reveals that ATP is released from single cells (indicated by arrows). The image was taken 3 s after a 25% stretch.
