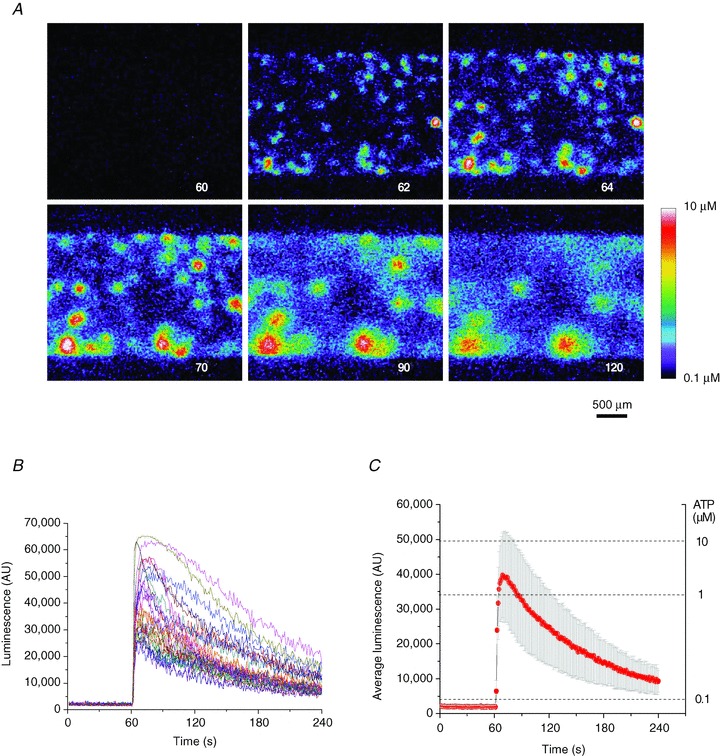
Figure 3. Time course of ATP release from A549 cells after a single stretch.

A, sequence of images showing ATP-dependent luminescence at different time points after 37% stretch of 1 s duration applied at 60 s. The experiment elapsed time (in seconds) is indicated in the lower right corner. A pseudo-colour scale of ATP concentration is shown on the lower right. Note the multiple ATP release sites and high (micromolar) ATP concentrations in their vicinity. The images disclose the cell culture area of approximately 3 × 2 mm. B, time course of local luminescence intensities at 37 release sites seen in A. Their average (±s.d.) is reported in C. Note the dual scale: luminescence intensity (left) and ATP concentration (right).
