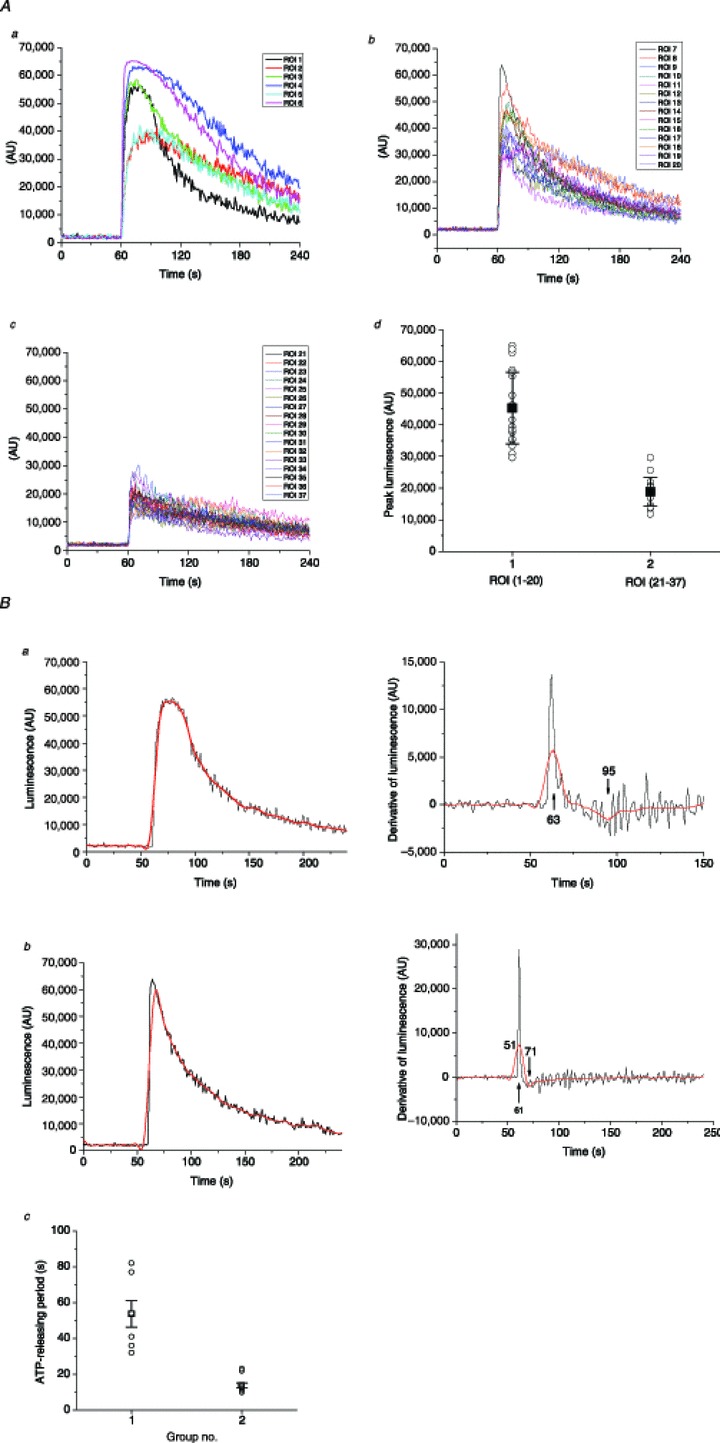
Figure 4. Peak amplitude and duration of ATP release from single cells.

A, stretch-induced ATP release responses from individual cells observed in the Fig. 3 experiment were grouped according to peak amplitude and duration (see text for more details): panel a, high-peak (>1 μm) and long-duration responses (six of 37); panel b, high-peak and short-duration responses (14 of 37); panel c, low-peak responses (<1 μm, 17 of 37); panel d, peak amplitude histogram of all responses grouped into two categories: high-peak responses (ROI 1–20) and low-peak responses (ROI 21–37). Solid black squares indicate average peak amplitude (±s.d.) for the two groups; statistically, they were significantly different at P < 0.05 (two-sample t test). B, ATP release duration analysis. Two examples, one of long and one of short release responses, are shown as black traces on the left in panels a and b respectively. Red traces represent the same traces after smoothing the data with Origin Lab software. On the right of each trace are shown the first time derivative of responses, calculated with Origin Lab software without smoothing (black line) and with previous smoothing of the data (red line). Arrows indicate the derivative maximum and minimum, which correspond to the time when ATP release started and ended respectively. For the examples reported here, they were at 63 s and 95 s for long-duration release, and 61 s and 71 s for short-duration release. Panel c represents a histogram of ATP release periods of all 37 responses observed in this experiment, where they are separated into two groups of short and long duration (see text for more explanations). Black squares and error bars indicate the average ±s.d. for each group. The two groups were statistically different at P < 0.05 (two-sample t test). ROI, region of interest.
