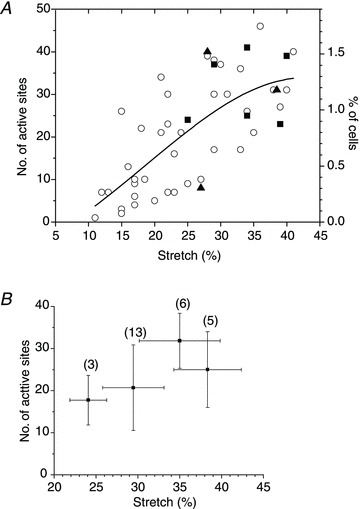
Figure 6. The number of responding cells grew with the extent of stretch.

A, the graph shows the number of cells releasing ATP after a single 1 s stretch of different amplitudes. Cumulative data from 48 experiments with 24 cell cultures, performed at low magnification (4× objective) with typically 2000–3000 cells in the field of view. The graph also includes data from the same cell cultures subjected to sequential stretches of increasing amplitude. ○, control; ▴, presence of the anion channel inhibitor 5-nitro-2-(3-phenylpropyl-amino) benzoic acid (100 μm); ▪, presence of the pannexin channel inhibitor carbenoxolone (100 μm). The continuous line represents Gaussian fit to the data. B, average number of cells (±s.d.) responding to a sequence of four stretches of increasing amplitude. This stretch protocol was used typically when testing the effect of putative ATP release inhibitors. Horizontal error bars indicate the s.d. of average stretch in each group of the sequential stretch protocol, and the number of stretches in each group is indicated in parentheses.
