
Figure 9. Effect of bafilomycin on ATP release.
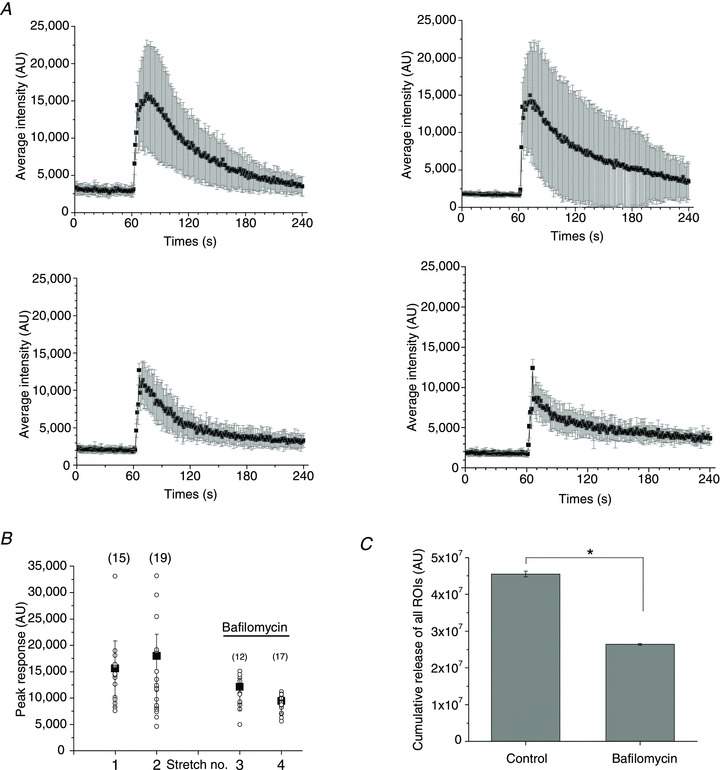
A, average (±s.d.) time course of ATP release from all responding sites under control conditions (two upper graphs) and after treatment with 5 μm bafilomycin for 30 and 60 min (left and right lower graphs respectively). The number of responding cells were similar for the two stretches under control conditions (15 and 19), compared to those observed in the presence of bafilomycin (12 and 17). B, peak ATP release responses before and after bafilomycin treatment. The data are from the same experiment as in A. For each stretch, the symbol ○ represents peak ATP release from individual release sites, and ▪ is the average ±s.d. for all responding sites (their number is indicated in parentheses). C, cumulative stretch-induced ATP release from all responding sites under control conditions and after treatment with bafilomycin. Data are the average ±s.d. of the experiments in A and B. They are representative of n= 6 stretches in the presence of bafilomycin with three different cell cultures. *Statistically significant difference (P < 0.05, two-sample t test).