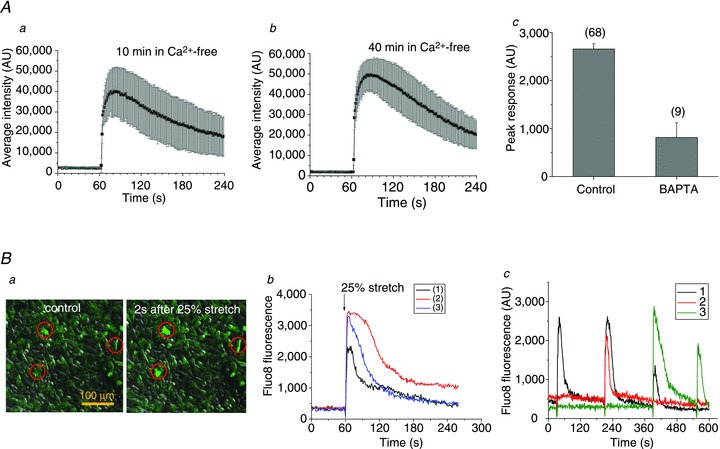
Figure 11. Role of Ca2+ in stretch-induced ATP release.

Aa and b show the average (±s.d.) time course of ATP release from all responding cells induced by stretch applied 10 min and 40 min, respectively, after removal of extracellular Ca2+. The two stretches were of 26% and 31% and the corresponding number of ATP releasing cells was 17 and 28. The responses were not different from those observed in the presence of extracellular Ca2+ (see Fig. 3). c, effect of a Ca2+ chelator BAPTA on stretch-induced ATP release. The graph shows average (±s.e.m.) of peak ATP release in control and BAPTA-loaded cells, and the number of responding cells appears in parentheses. Cells were loaded with 30 μm BAPTA-AM (80 min, 37°C). Ba, Fluo8 fluorescence and DIC overlay images of A549 cells in a stretch chamber before (control) and 2 s after 25% stretch, in left and right images respectively. The stretch-induced [Ca2+]i elevations seen as fluorescence increase in cells marked by red circles. b, example of time course of [Ca2+]i changes, recorded as Fluo8 fluorescence intensity, in three A549 cells, shown in a, that responded to single stretch. Stretch was applied at 60 s (indicated by the arrow). c, time course of [Ca2+]i responses to repetitive stimulation reported as Fluo8 fluorescence in three different cells in the field of view (indicated by black, green and red traces). A sequence of four stretches (28%, 34%, 34% and 39%) was applied at 30, 210, 390 and 550 s.
