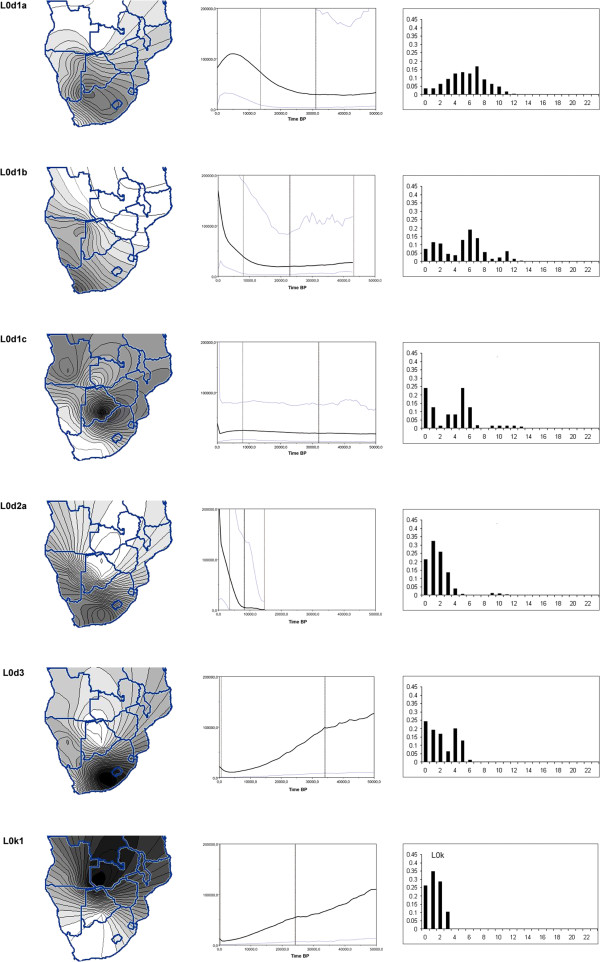
Figure 4.
Contour plots, Bayesian Skyline Plots and mismatch distributions of L0d/k haplogroups. First Column: Contour plots indicating the frequency distributions of L0d/k subgroups. Color range is from 0 (white) to >60% (black) in increasing shades of gray. Second Column: Bayesian Skyline plots of haplogroups showing changes in Ne through time. Ne is represented on the Y-axis, while years ago are represented on the X-axis, with the present indicated by 0. L0d3 includes only L0d3 sequences from the present study (see Additional file 2: Figure S9 for inclusion of east African and Kuwait sequences). Black bold vertical lines indicate the coalescence date and the lighter vertical lines the 95% confidence intervals for the coalescence. Blue lines indicate the 95% confidence intervals for BSP lines (black). Third Column: Mismatch distributions of L0d/k sub-haplogroups.

